Single-cell meta-analysis of inflammatory bowel disease with scIBD
Understanding the heterogeneous intestinal microenvironment is critical to uncover the pathogenesis of inflammatory bowel disease (IBD). Recent advances in single-cell RNA sequencing (scRNA-seq) have identified certain cell types and genes that could contribute to IBD. However, a comprehensively integrated analysis of these scRNA-seq datasets is not yet available. Here we introduce scIBD, a platform for single-cell meta-analysis of IBD with interactive and visualization features. scIBD combines highly curated single-cell datasets in a uniform workflow, enabling identifying rare or less-characterized cell types in IBD and dissecting the commonalities and differences between ulcerative colitis and Crohn's disease. scIBD also incorporates multi-functional information, including regulon activity, GWAS-implicated risk genes, and genes targeted by therapeutics, to infer clinically relevant cell-type specificity. Collectively, scIBD is a user-friendly web-based platform for the community to analyse the transcriptome features and gene regulatory networks associated with the pathogenesis and treatment of IBD at the single-cell resolution.
Overview of scIBD datasets and annotations
Mailing address
Institute of Cancer Research,
Shenzhen Bay Laboratory,
Guangming District, Shenzhen, Guangdong,
P.R. China
Developed by Lei Zhang Lab | © Copyright 2022
FAQ
Q1: What is scIBD?
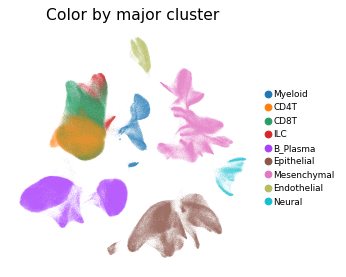
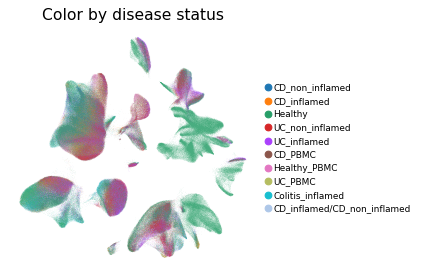
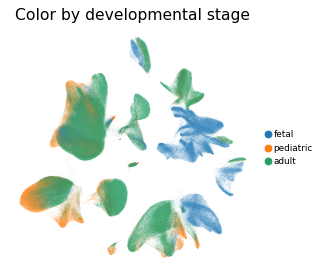
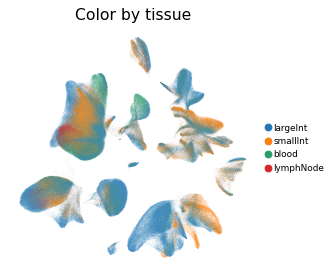
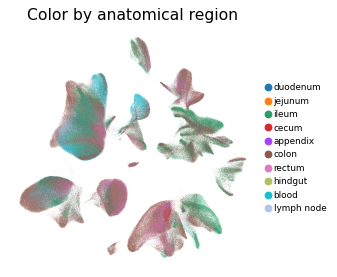
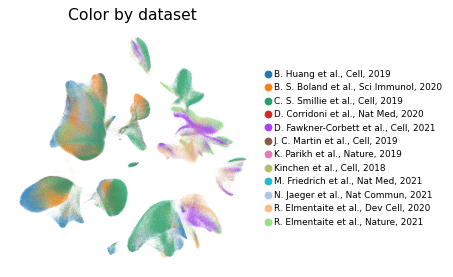
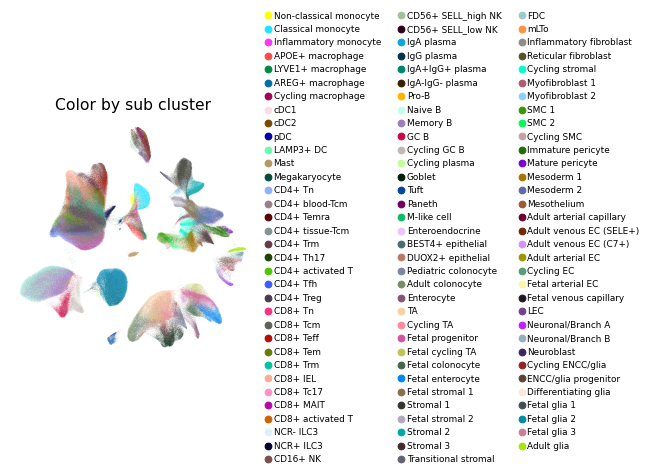
scIBD is a platform for single-cell meta-analysis of inflammatory bowel disease (IBD) that contains ~1.14 million single cells from 12 datasets across multiple development stages (including fetal, pediatric, and adult), tissues from multiple anatomical regions (includign blood, small intestine and large intestine, etc.) and different disease states (healthy, inflammed UC, inflammed CD, etc.). scIBD comprises 9 major subtypes (Myeloid, CD4 T cells, CD8 T cells, ILCs, B/Plasma cells, Epithelial cells, Mesenchynal cells, Endothelial cells, and Neural cells), and 101 cell subtypes. scIBD provides a multi-functional and user-friendly interface that provides interactive visualization for biologists to analyse the transcriptome features, gene regulatory networks and enrichment of given gene set in each cell subset.
Q2: What are the feature functions of scIBD?
We have integrated 12 datasets from multiple studies which investigate the pathologies of IBD, and present a comprehensive single cell transcriptomic atlas for further studying IBD. With scIBD, users are convenient to explore signature genes of each cell subtype, and compare gene expression of given genes (such as therapy targets, cytokines, IBD-GWAS related genes, or others) between health and disease across major clusters or cell subtypes. With scIBD, users are also convenient to explore the underlying gene regulatory networks (GRNs) of each cell subtype, and compare the activities of given regulons between health and disease. IBD is caused by a complex interaction between genetic and environment factors (such as gut microbes). Currently, treatments for IBD including 5-ASA, antibiotics, steroids, immunosuppressants, and biologic therapies (including anti–tumor necrosis factor [TNF] antibodies, anti–α4β7 integrin antibodies, and anti–IL12/23 antibodies). For convenience,scIBD also collected clinical trials, therapy targets, and GWAS-implicated risk genes to give a quick glance of advances in the treatment of IBD. With scIBD, user could capture both the enriched cell subsets and gene expression profiles of the risk genes for UC and CD or any given gene set.
Q3: How did you perform the cell type annotations?
Preprocessing and integration of scRNA-seq datasets were performed with Scanpy. Raw count matrix of gene expression of all samples in all datasets were merged. We used a double-MAD (median absolute deviation) method to detected the outliers of number of expressed genes in all cells with lower threshold of 1.5 and upper threshold of 10. As a result, cells with fewer than 399 genes or more than 6,849 genes, or > 25% mitochondrial UMI counts were filtered out. Samples with less than 100 cells were dropped. Then, we used a two rounds clustering strategy to integrate, cluster and annotate major clusters and minor clusters.
In the first-round clustering, immunoglobulin genes, T cell receptor (TCR) genes, and ribosome-protein-coding genes (gene symbol with string pattern “^RP[0-9]+-|[LS]”), cell cycling genes (e.g. TOP2A, MKI67), and mitochondrial genes were removed from the combined gene expression matrix. For each cell, the UMI counts of genes were divided by the total UMI count of the cell and then scaled by 1e4, and then log-transformed. Top 2,000 highly variable genes were identified across cells and samples (with highly_variable_genes function with scanpy (v1.8.2, n_top_genes=2000 and batch_key = “sampleName”). These 2,000 highly variable genes were used for downstream analysis. The expression values of each gene were scaled to unit variance, and PCA were performed. Batch correction of datasets from multiple studies which covered three developmental stages and multiple disease conditions, was performed with bbknn (v1.5.1, bath_key="sampleName", neighbors_within_batch=3, metric="euclidean", n_pcs =30). Dimensionality reduction (t-SNE and UMAP) and leiden clustering (resolution=0.1) was performed and major clusters were annotated based on canonical marker genes and differentially expressed genes (DEGs).
In the second-round, integration and clustering of given major cluster were similar to first-round. We checked the gene expression of canonical marker genes, and sub clusters expressed marker genes from other major clusters were considered as doublets and dropped. Then, each major cluster was integrated and clustered again, and minor clusters were annotated based on marker genes identified from DEGs and published studies.
Contact Details
Scientific Problems
We welcome any suggestions regarding how to improve our database, please feel free to contact us with feedback.
Please contact the first author Hu Nie: niehu2021@163.com, and the corresponding author Lei Zhang: leah.zhanglei@szbl.ac.cn
Technical Problems
If you have any questions about the usage of scIBD and the interpretation of results, or encounter problems when using scIBD.
Please contact the first author Hu Nie: niehu2021@163.com, and the corresponding author Lei Zhang: leah.zhanglei@szbl.ac.cn
Address
Gaoke Innovation Center, Guangqiao Road, Guangming District, Shenzhen
Institute of Cancer Research
Shenzhen Bay Laboratory
Guangdong, China
Tel: 86-10-26849285