Single-cell meta-analysis of inflammatory bowel disease with scIBD
Understanding the heterogeneous intestinal microenvironment is critical to uncover the pathogenesis of inflammatory bowel disease (IBD).
Recent advances in single-cell RNA sequencing (scRNA-seq) have identified certain cell types and genes that could contribute to IBD.
However, a comprehensively integrated analysis of these scRNA-seq datasets is not yet available.
Here we introduce scIBD, a platform for single-cell meta-analysis of IBD with interactive and visualization features.
scIBD combines highly curated single-cell datasets in a uniform workflow, enabling identifying rare or less-characterized cell types in IBD and
dissecting the commonalities and differences between ulcerative colitis and Crohn's disease.
scIBD also incorporates multi-functional information, including regulon activity, GWAS-implicated risk genes, and genes targeted by therapeutics,
to infer clinically relevant cell-type specificity. Collectively, scIBD is a user-friendly web-based platform for the community to analyse the
transcriptome features and gene regulatory networks associated with the pathogenesis and treatment of IBD at the single-cell resolution.
Overview of scIBD datasets and annotations
Mailing address
Institute of Cancer Research,
Shenzhen Bay Laboratory,
Guangming District, Shenzhen, Guangdong,
P.R. China
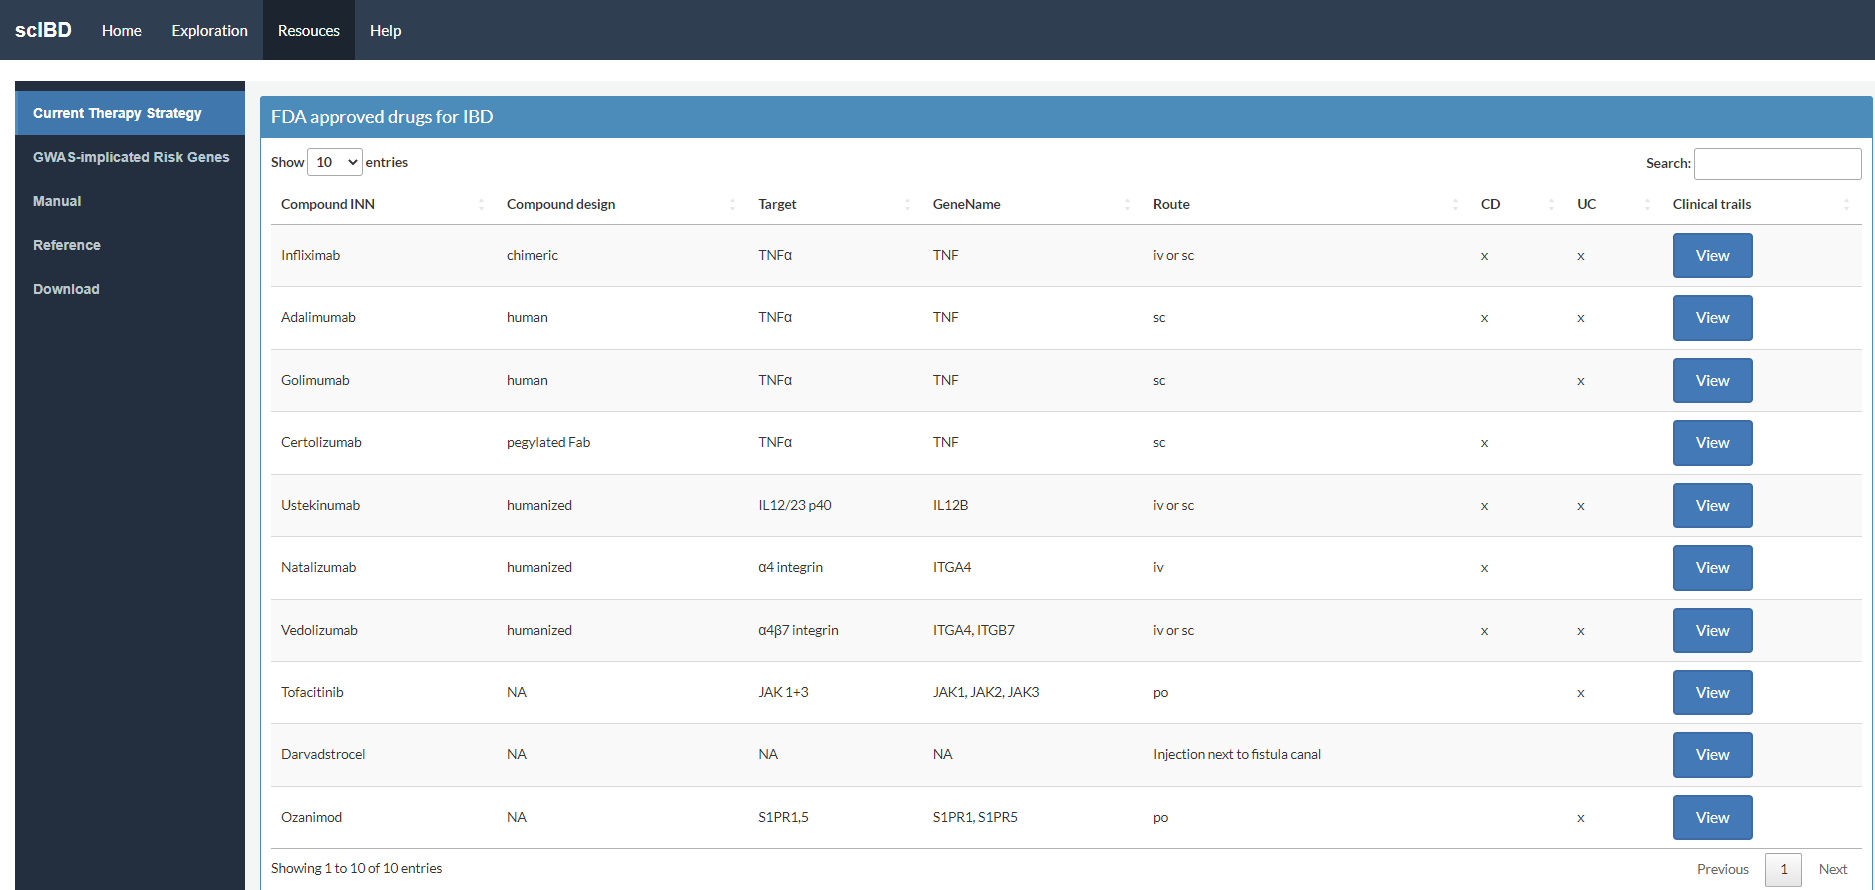
Route: iv (intravenous) represents administration within or into a vein or veins; sc (subcutaneous) represents administration beneath the skin; po (Oral) represents administration to or by way of the mouth
CD represents Crohn’s disease; UC represents ulcerative colitis; x represents that the drug can be used to treat UC or CD
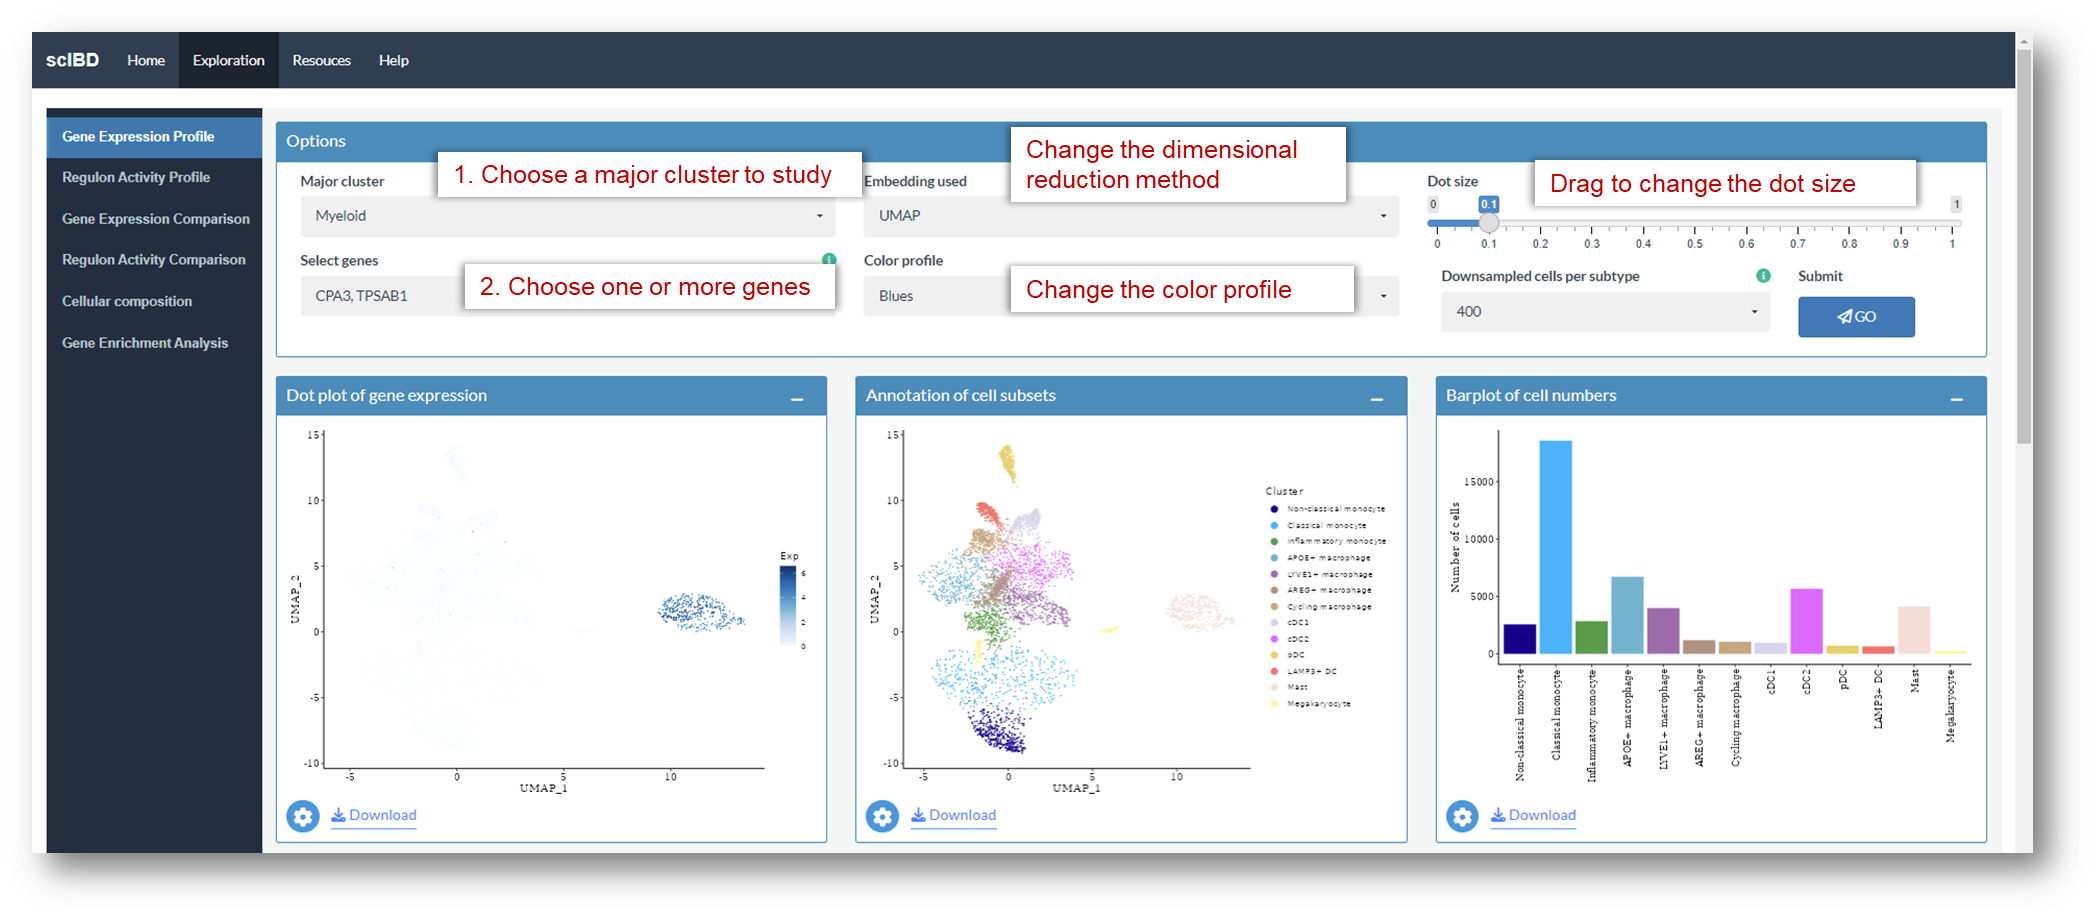
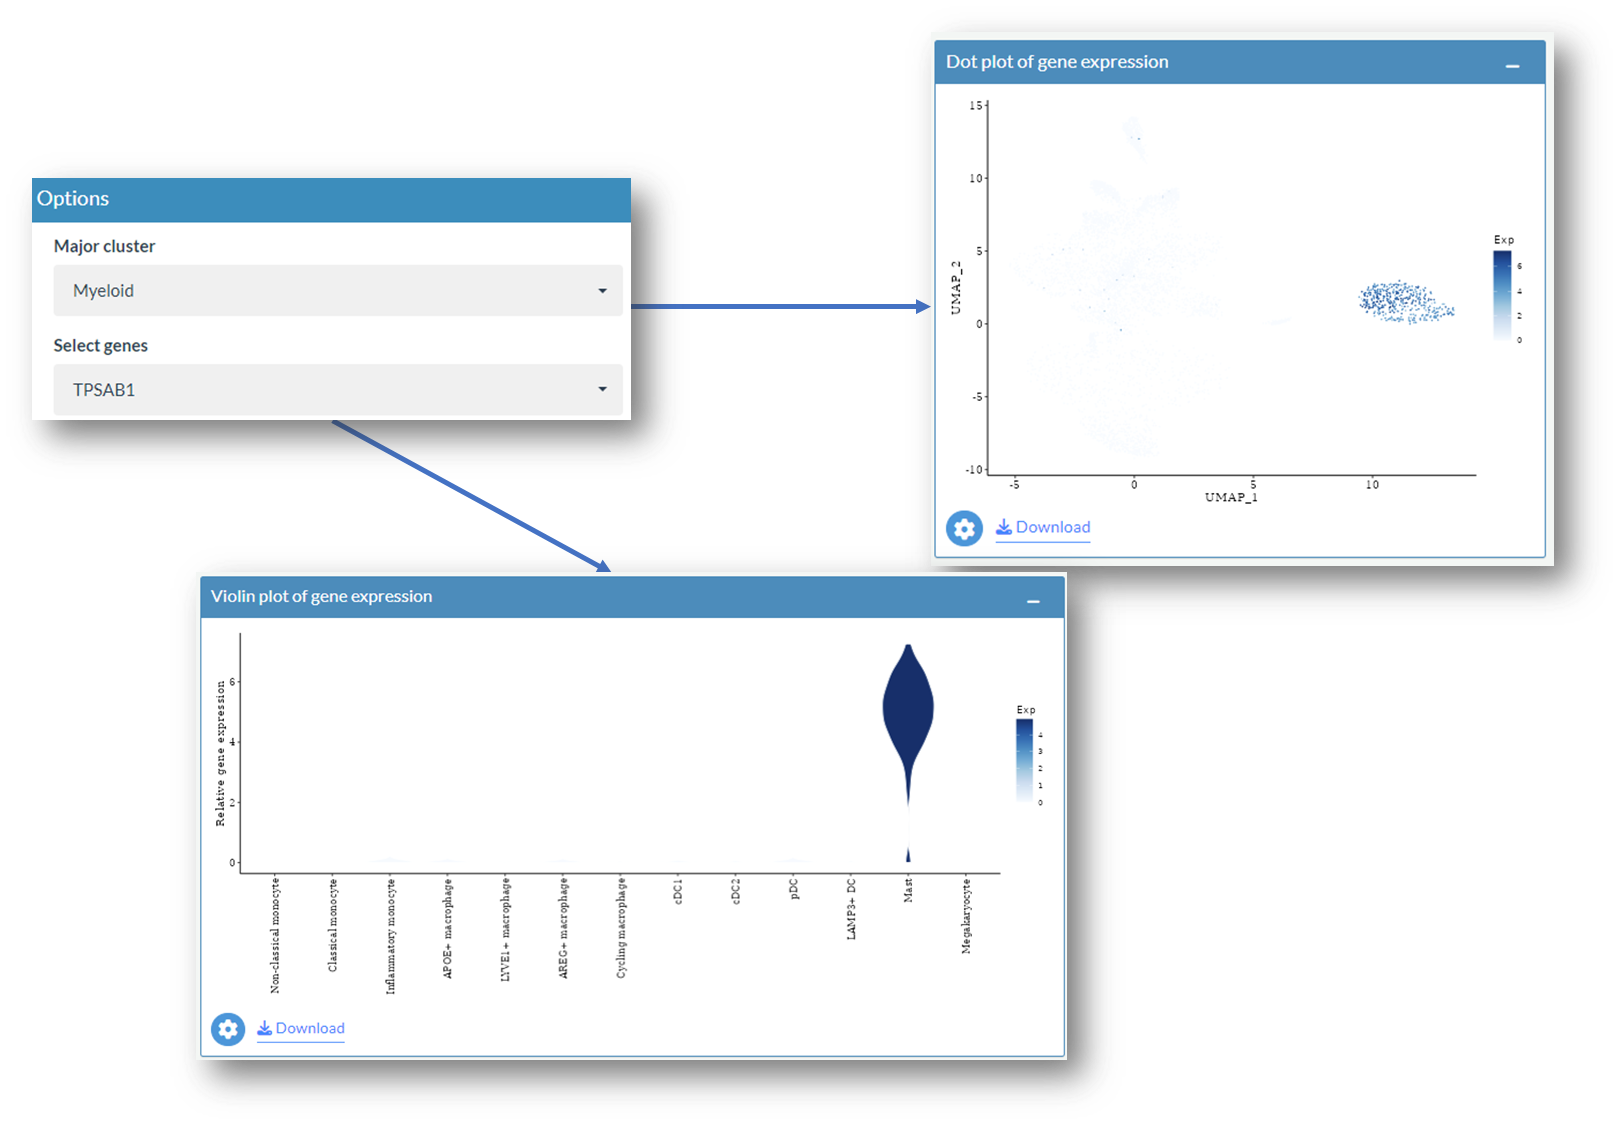
After access scIBD, go to the Exploration page, click the Gene Expression Profile tab, the following interface will be shown. By default, expression levels of CPA3 and TPSAB1 are queried in the myeloid compartment.
Example: Explore differential expressed genes in myeloid compartment
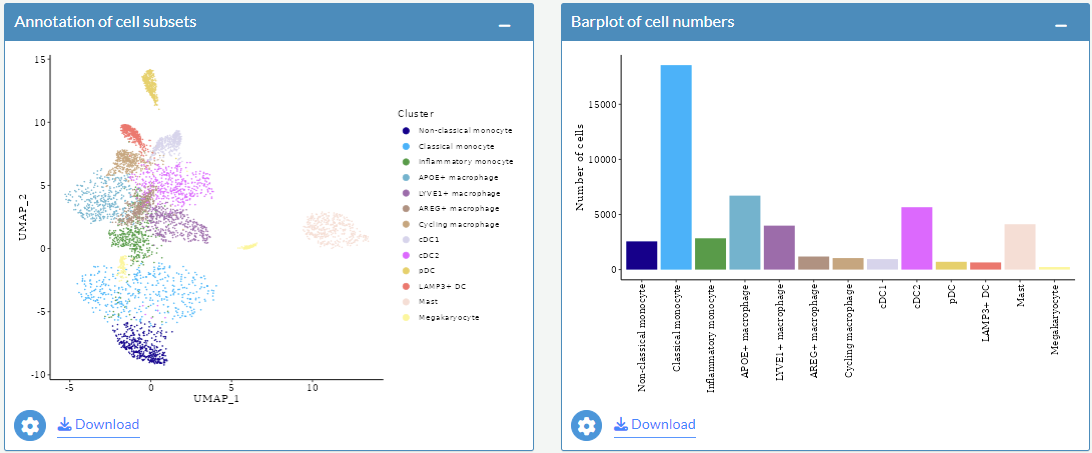
After selecting Myeloid as major cluster, annotations of cell subsets (left) and number of cells (right) in myeloid compartment will be shown. The calculation of the cell numbers is based on the whole data set not the down sampled data set.
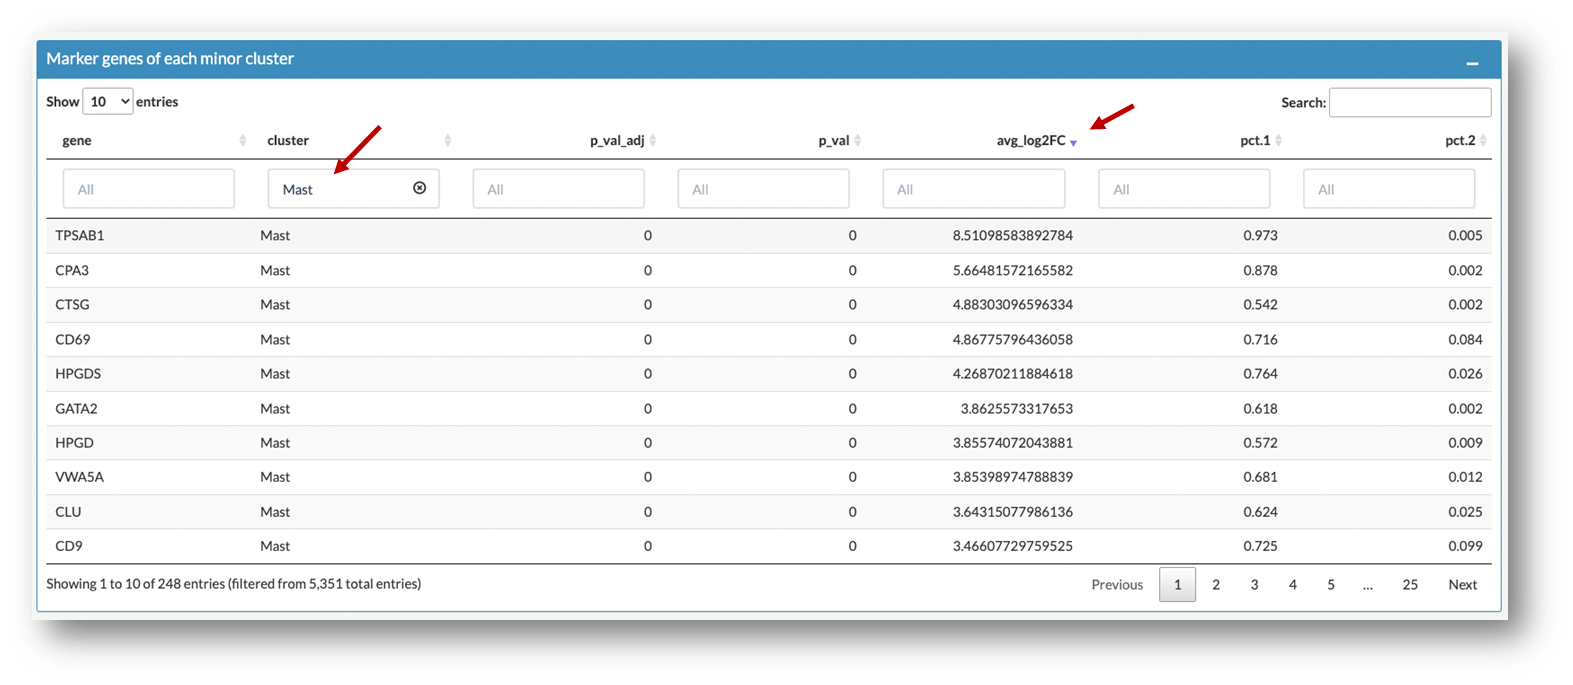
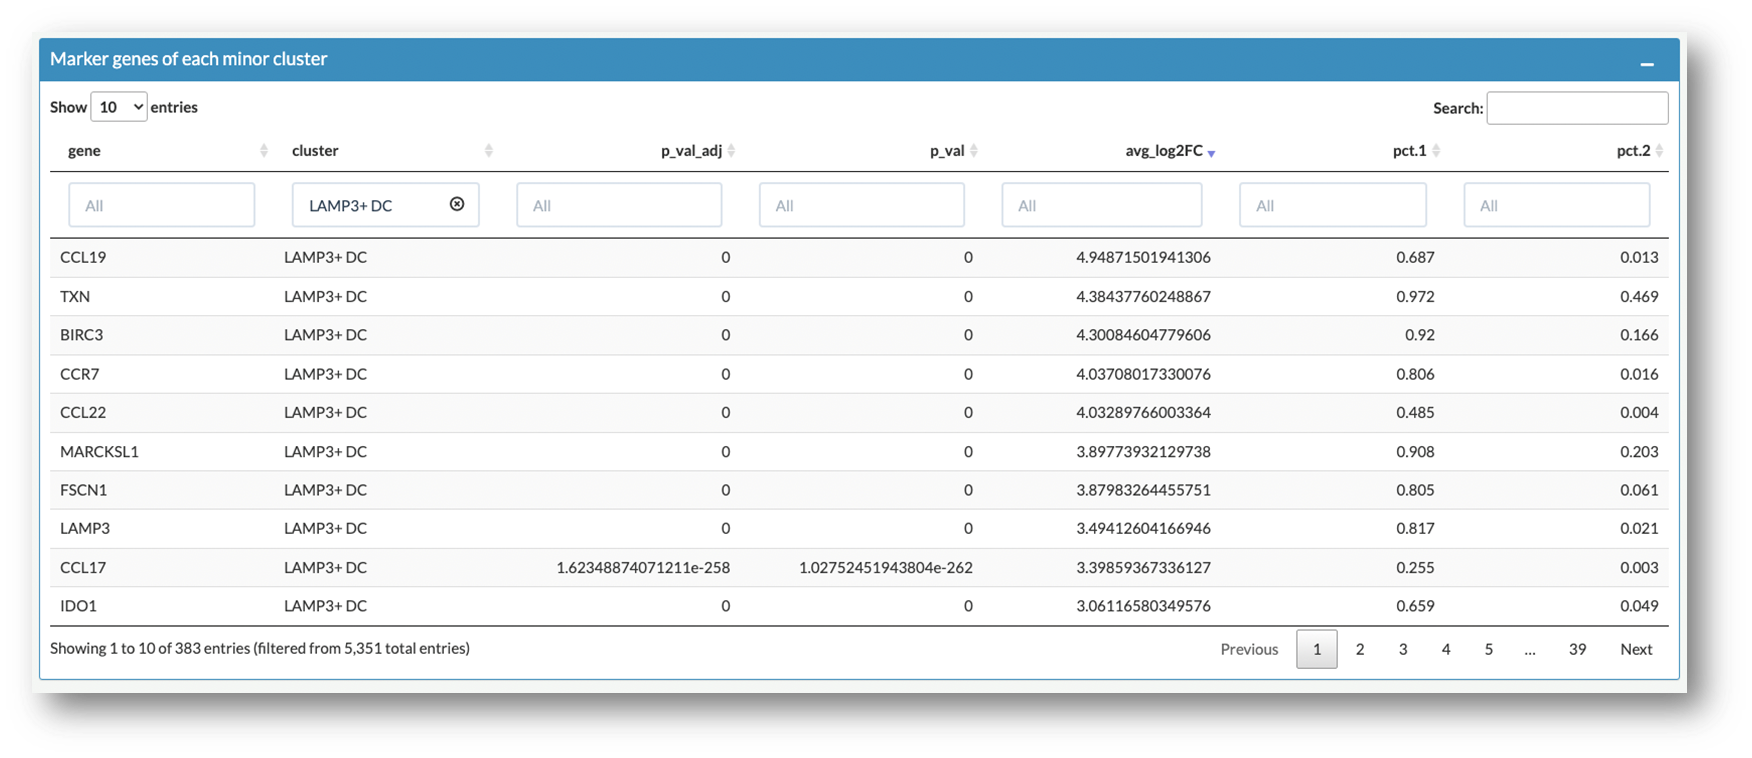
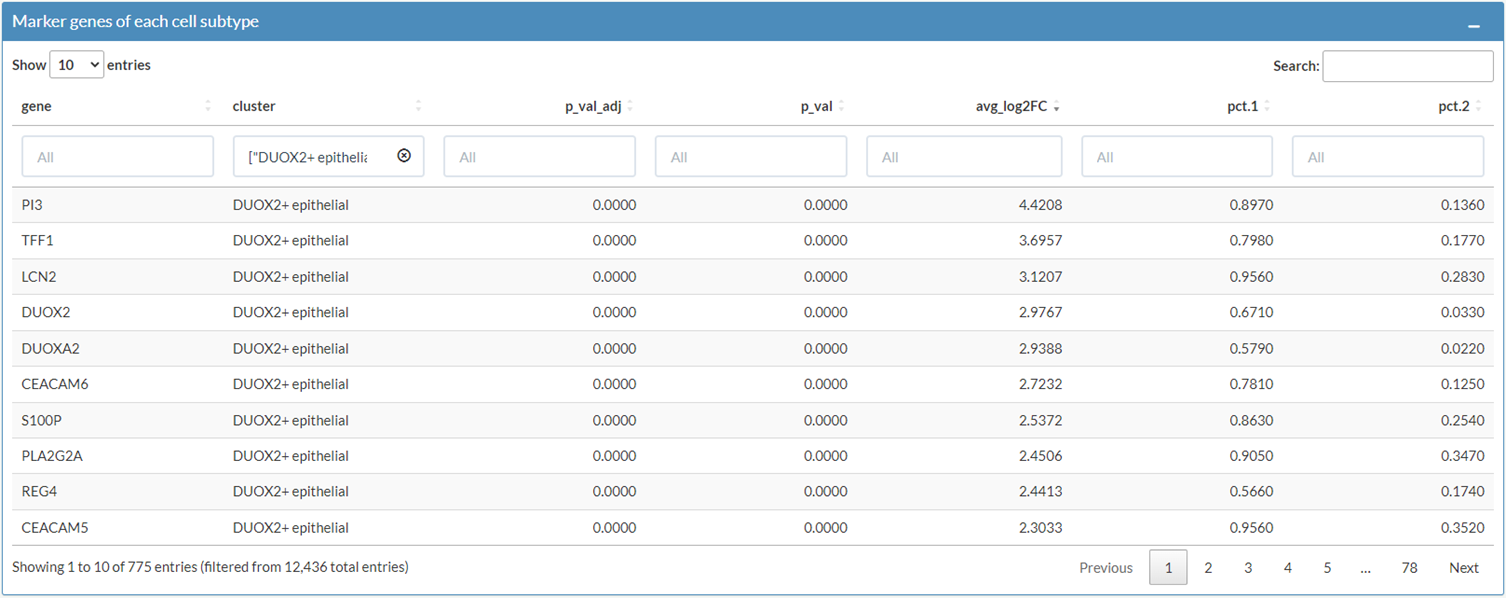
User can browser the top signature genes of each cell subtype in Heatmap plot of marker genes box and Marker genes of each cell subtype box.
After choosing Mast cell and ranking the list according to avg_log2FC, differential expressed genes are listed. User can explore and compare their expression profiles in the Gene Expression Profile tab and the Gene Expression Comparison tab.
cluster: cell subtypes in myeloid compartment
p_val: p value calculated by wilcoxon test
p_val_adj: adjusted p value, based on based on bonferroni correction using all genes in the dataset.
avg_log2FC: average log 2 fold change
Select one gene of interest
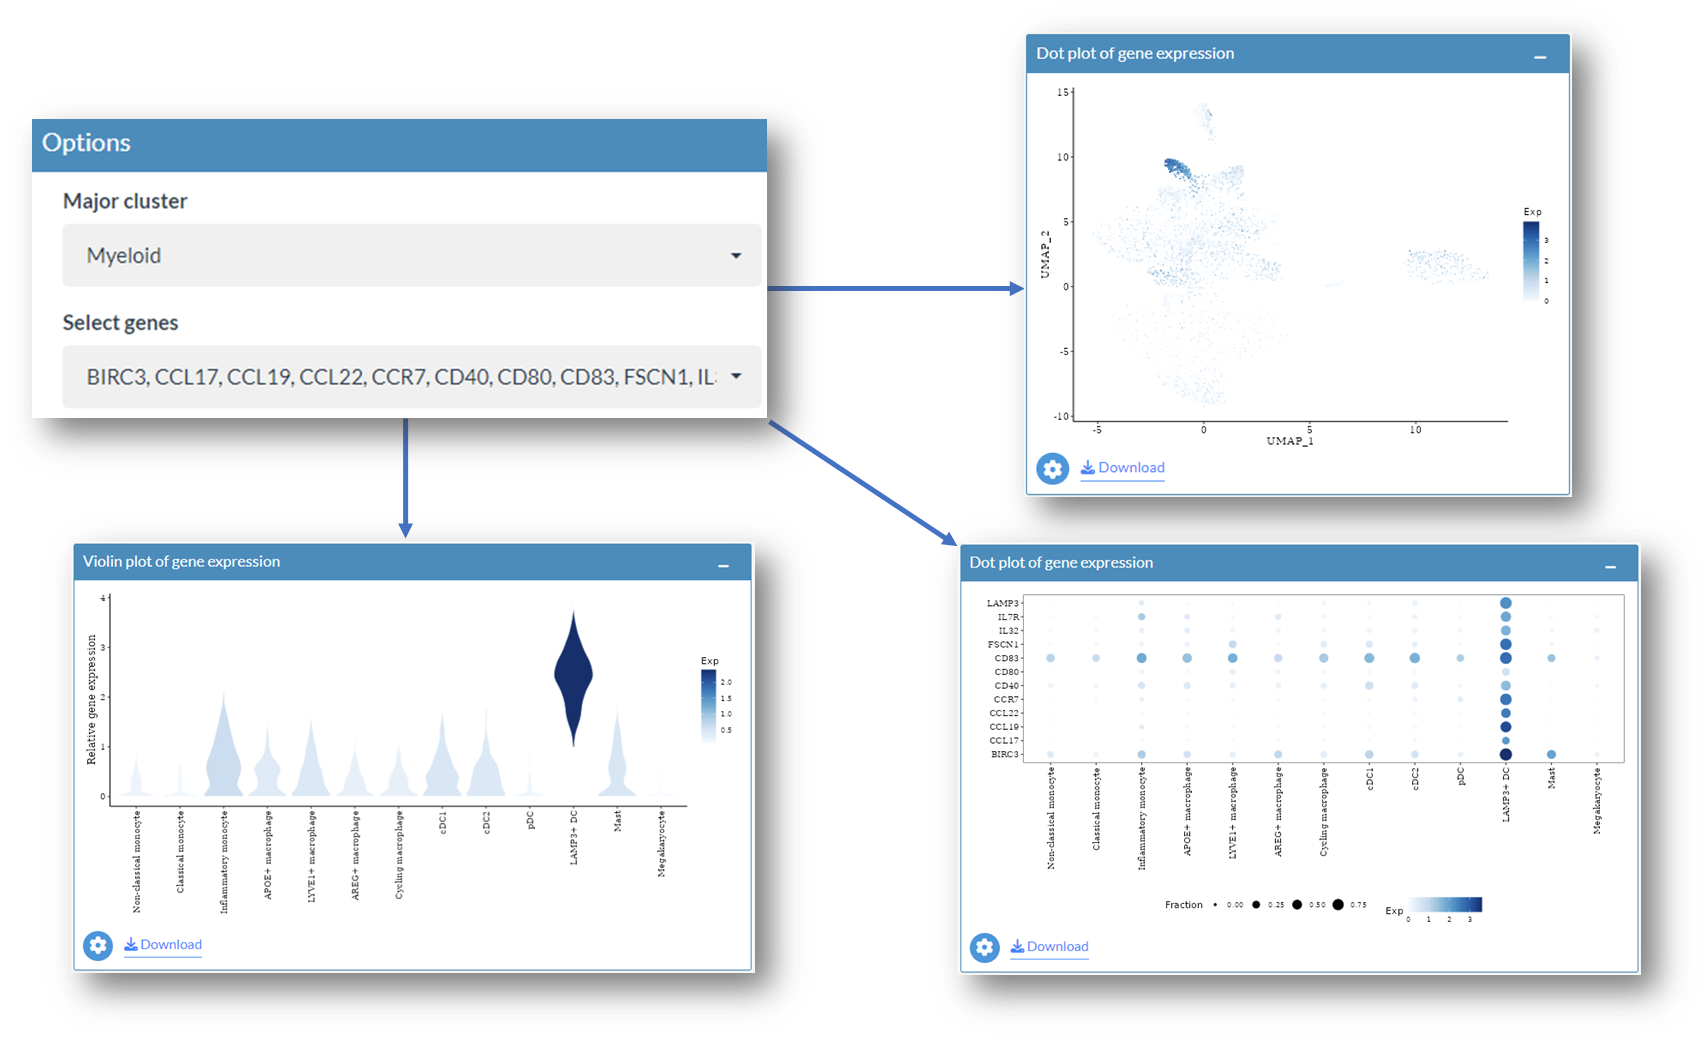
Similarly, after choosing LAMP3+ DC and ranking the list according to avg_log2FC, differential expressed genes are listed. You can explore and compare their expression profiles in the Gene Expression Profile tab and the Gene Expression Comparison tab.
Select multiple genes of interest
2. Explore regulon activity for cell subtypes
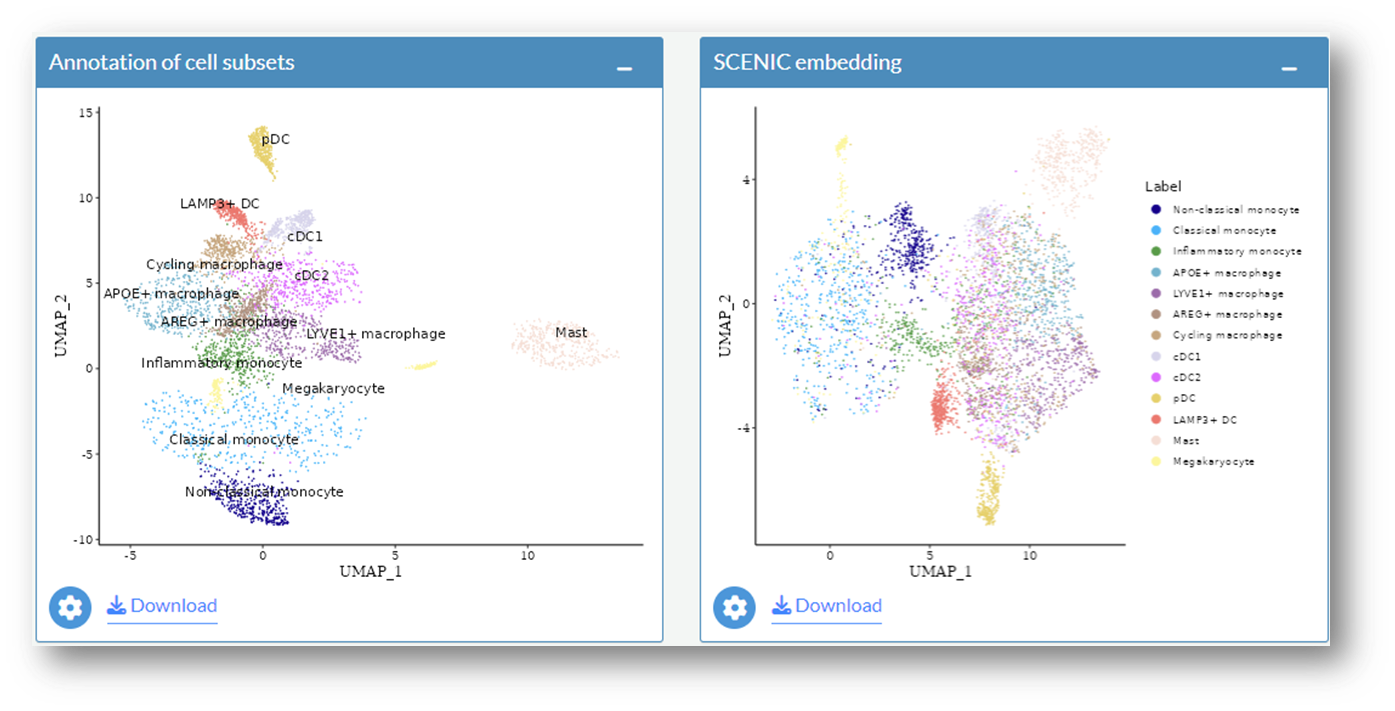
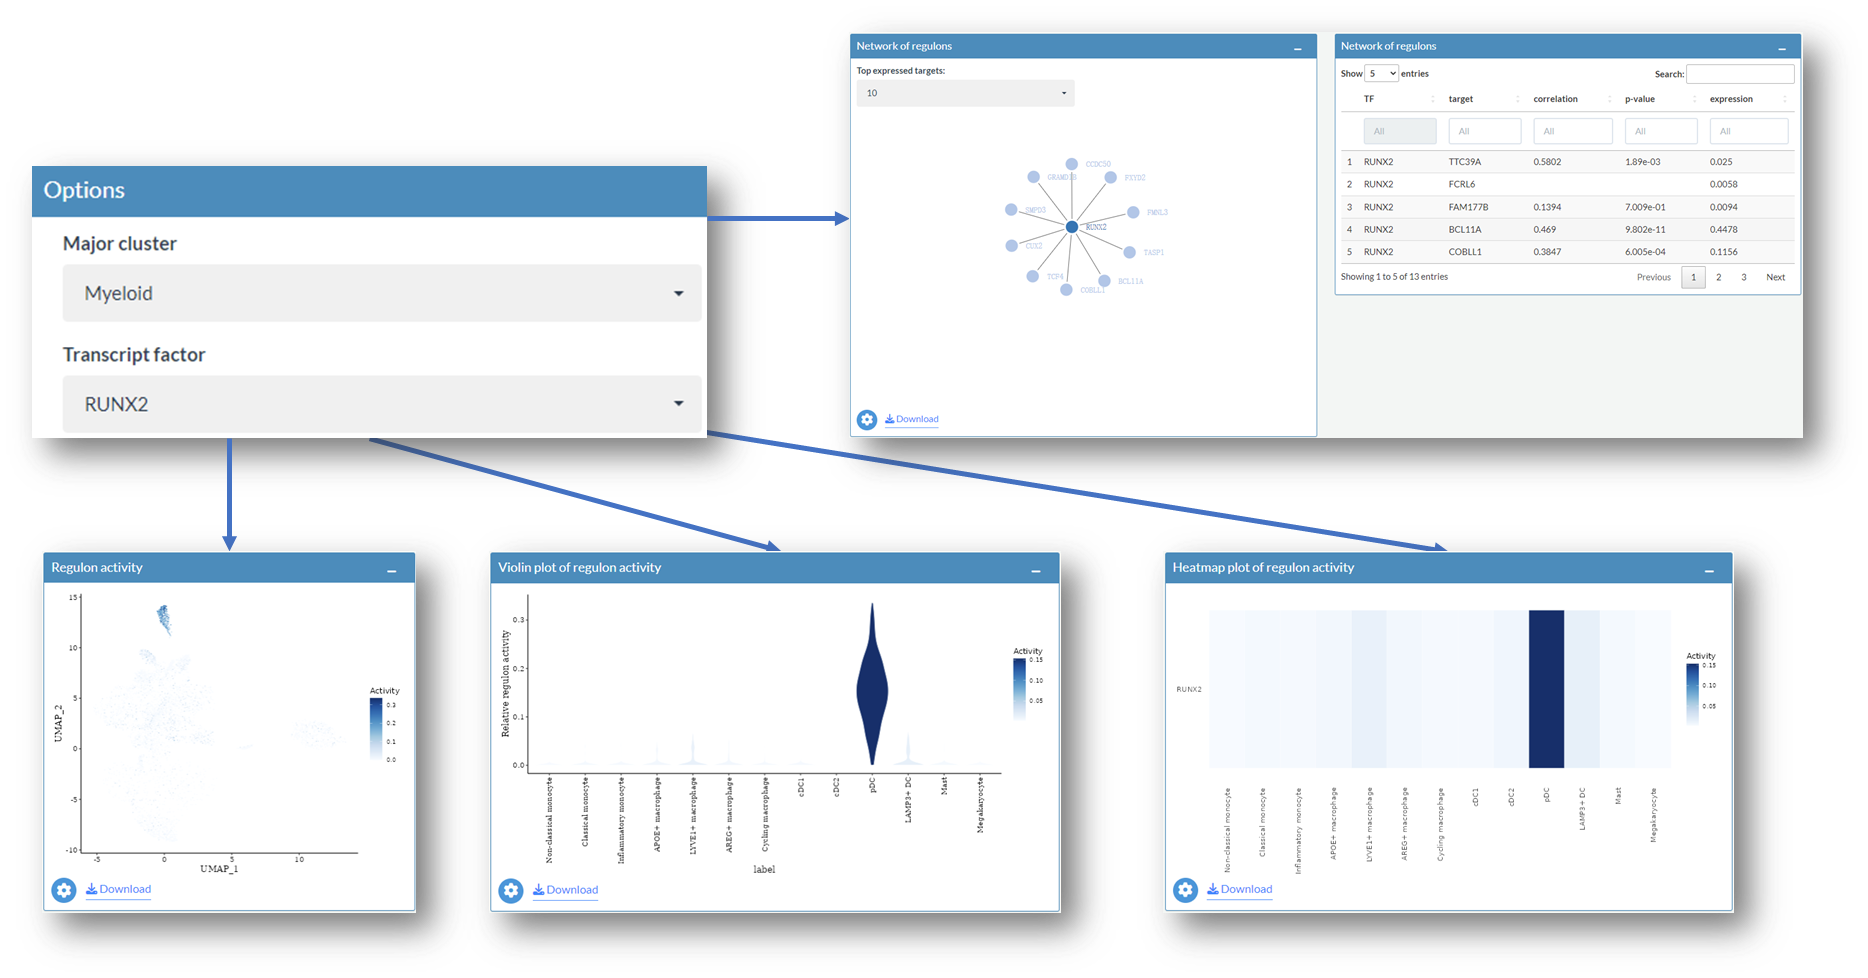
This section illustrates how to explore the regulon activity in each cell subtype. After selecting Myeloid as major cluster, UMAP embedding (left) and SCENIC embedding (right) with annotations of cell subsets in myeloid compartment will be shown.
Example: Explore regulons in the myeloid compartment
Select one regulon of interest
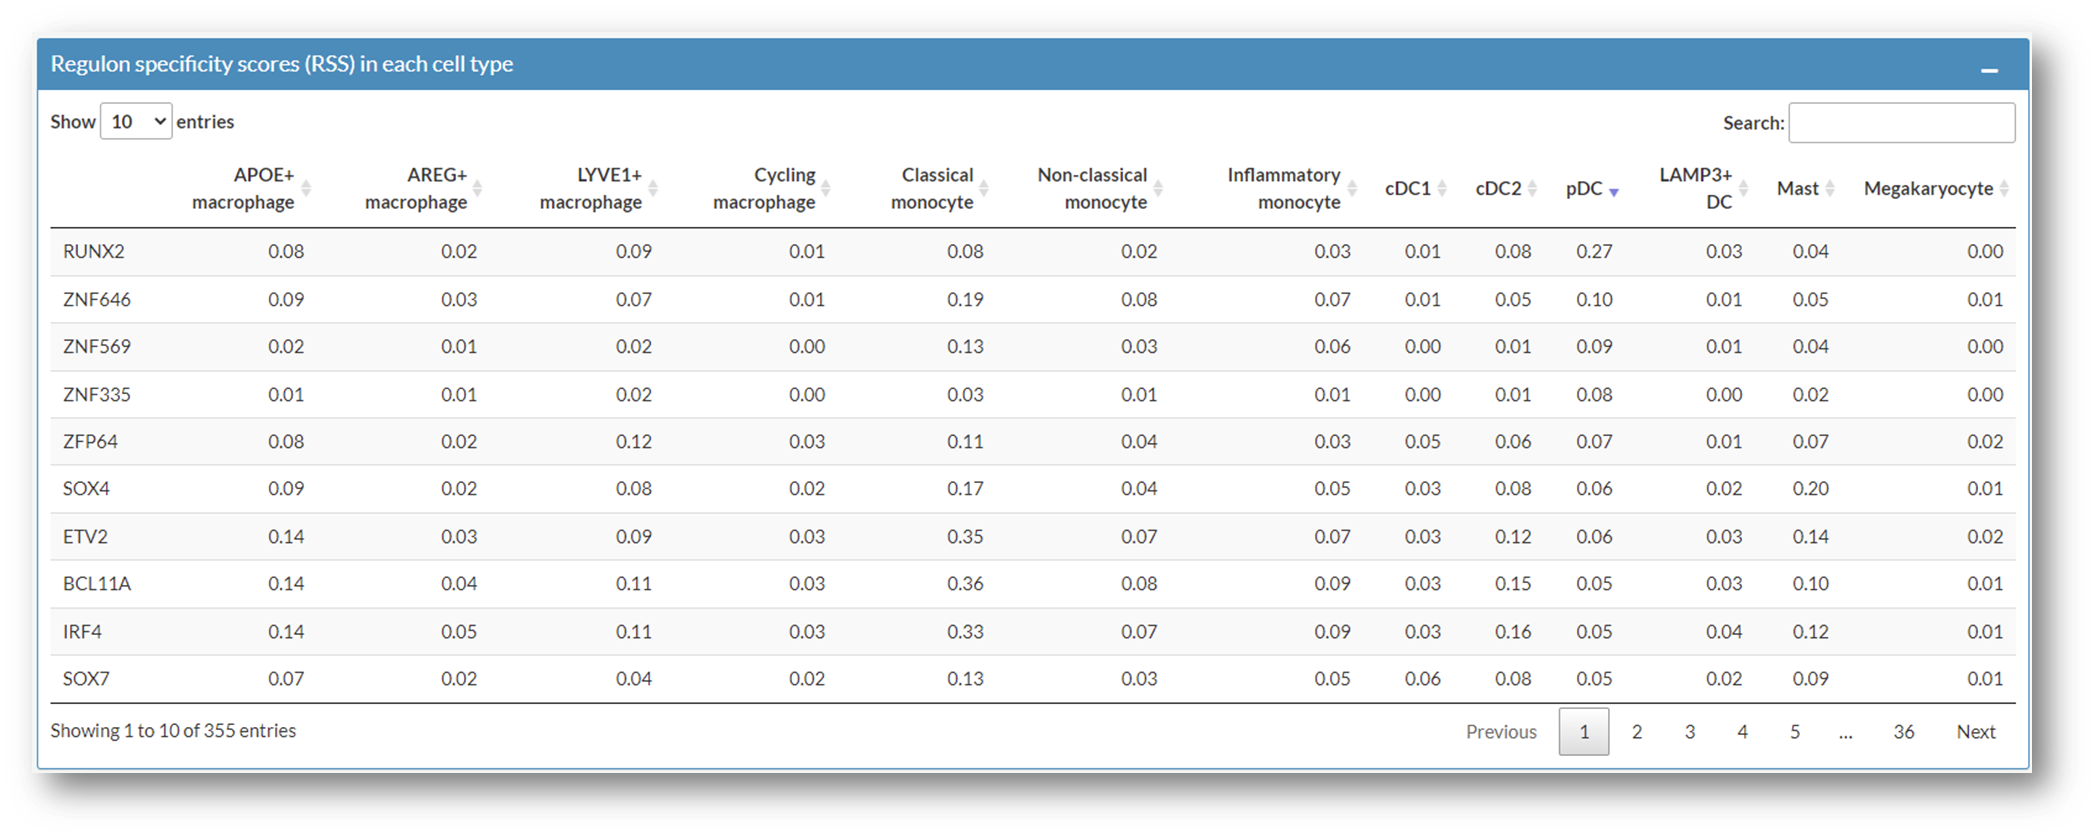
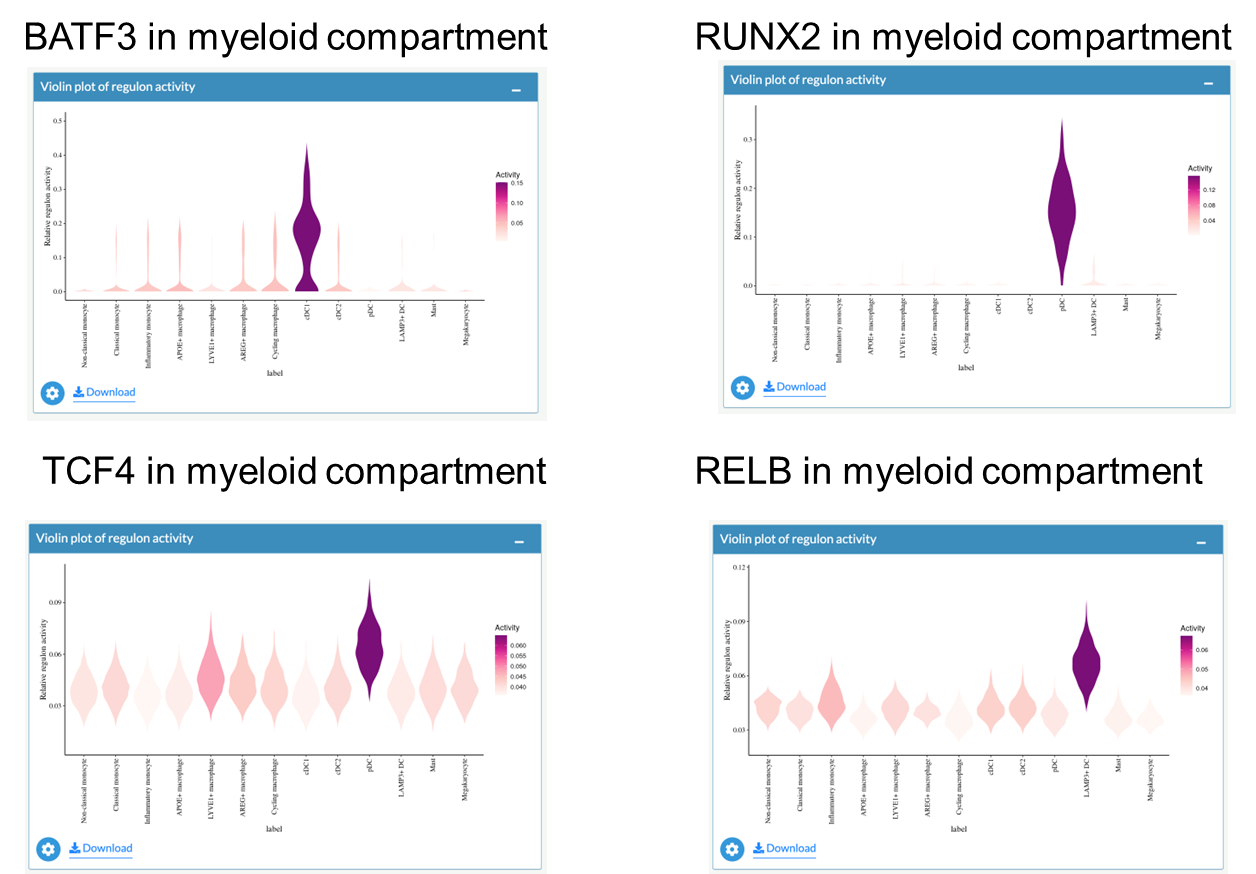
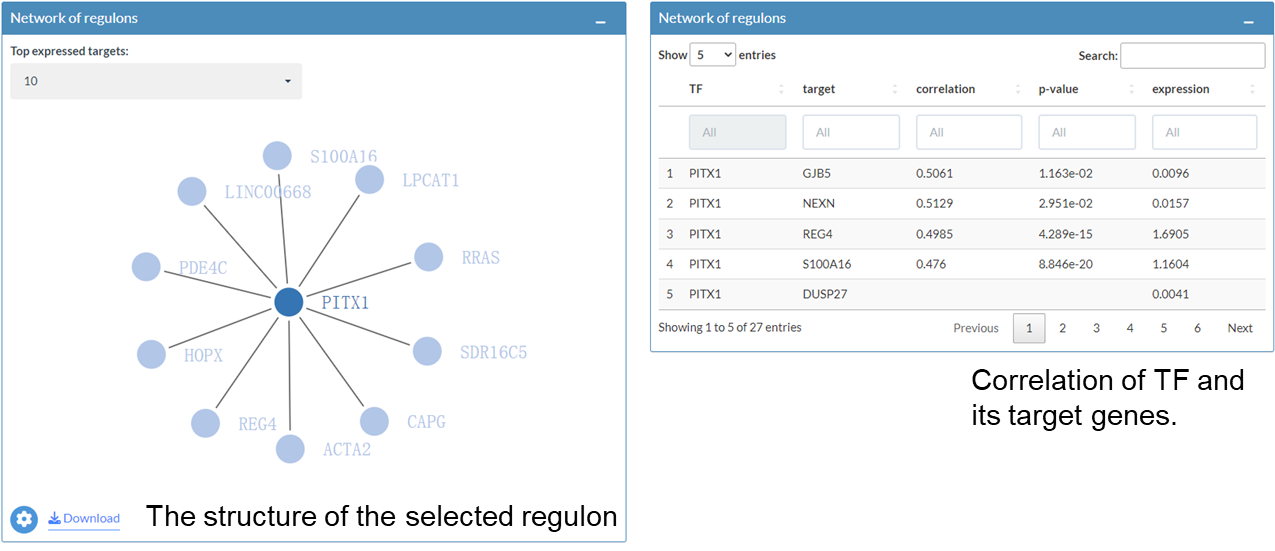
Activities of regulons in myeloid compartment
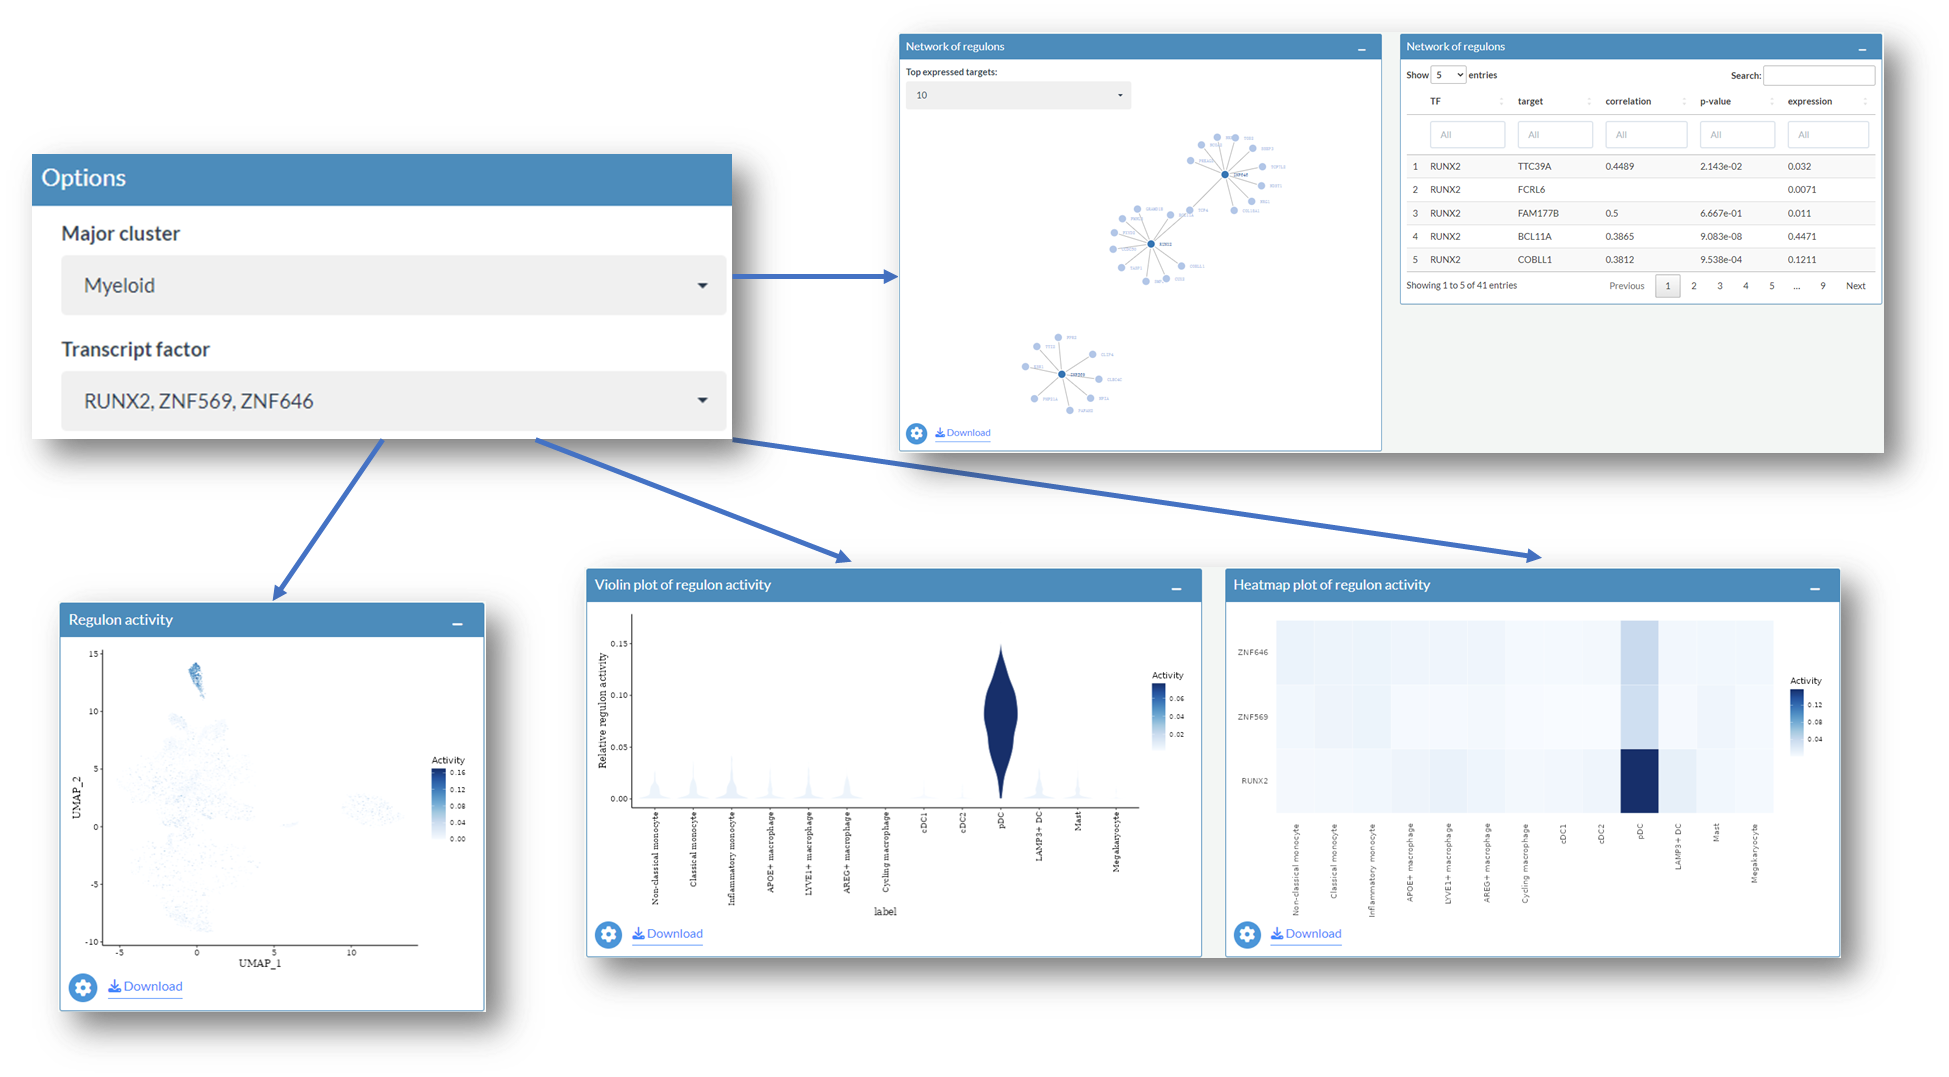
Select multiple regulons of interest
The Network of regulons interactive
3. Compare gene expression between healthy individuals and patients with IBD
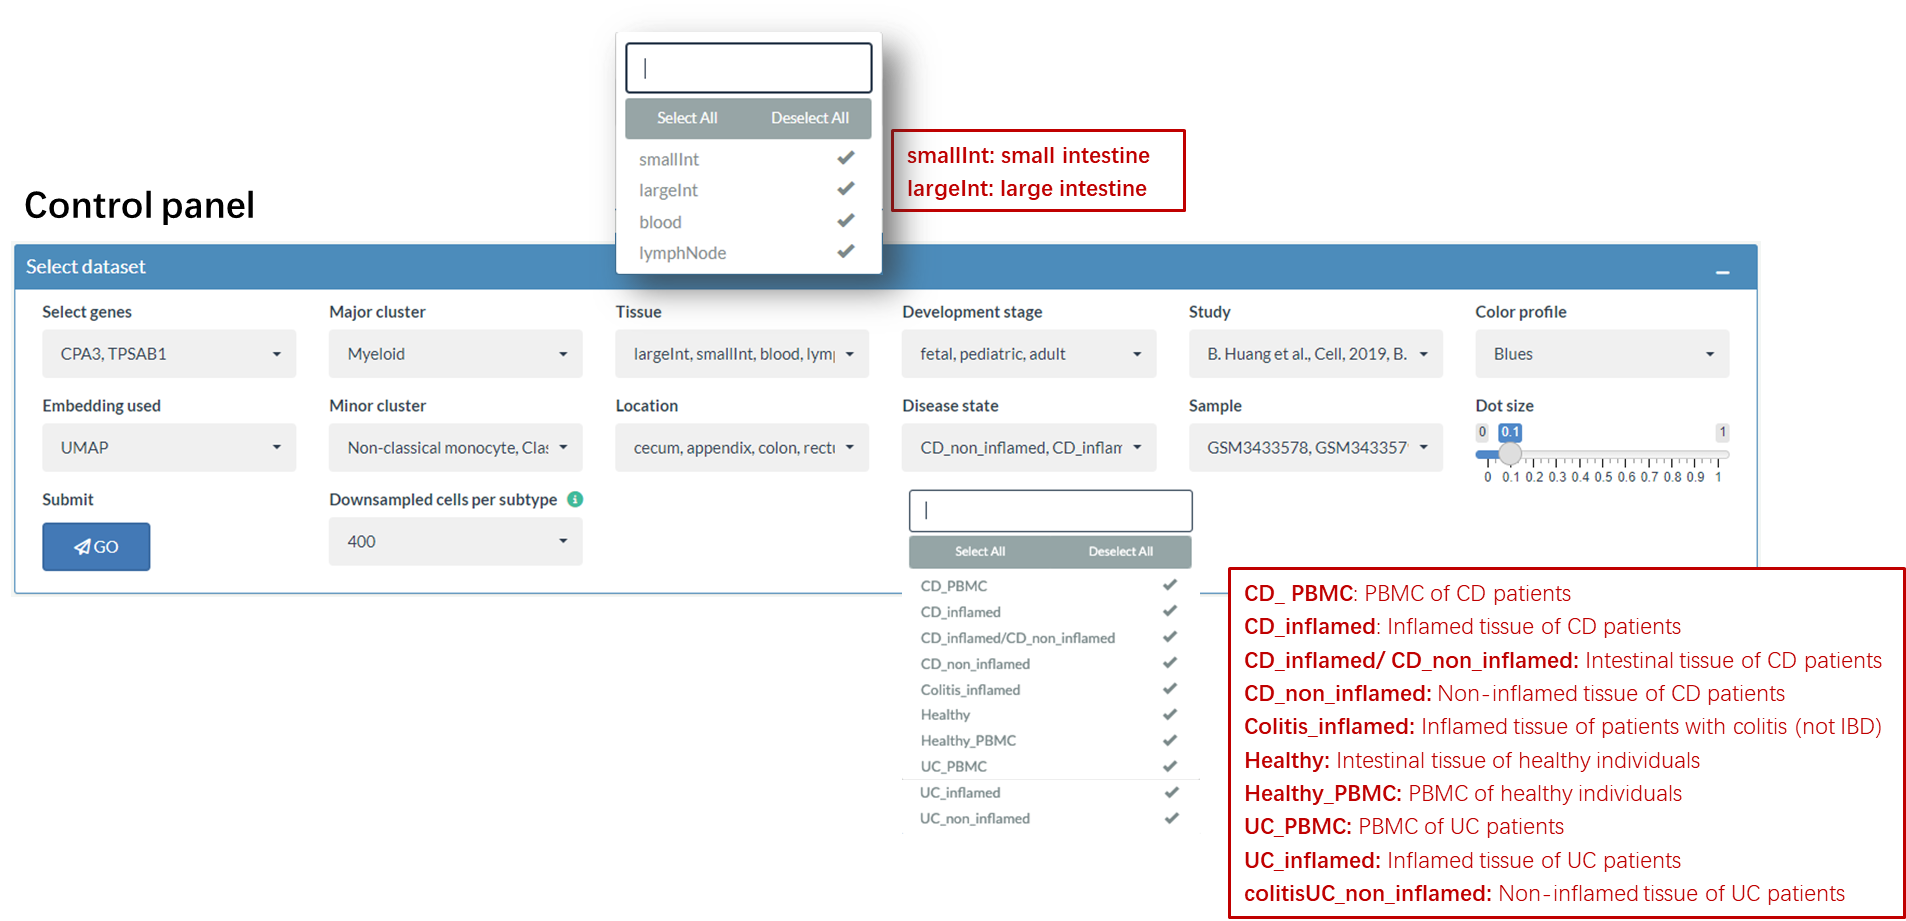
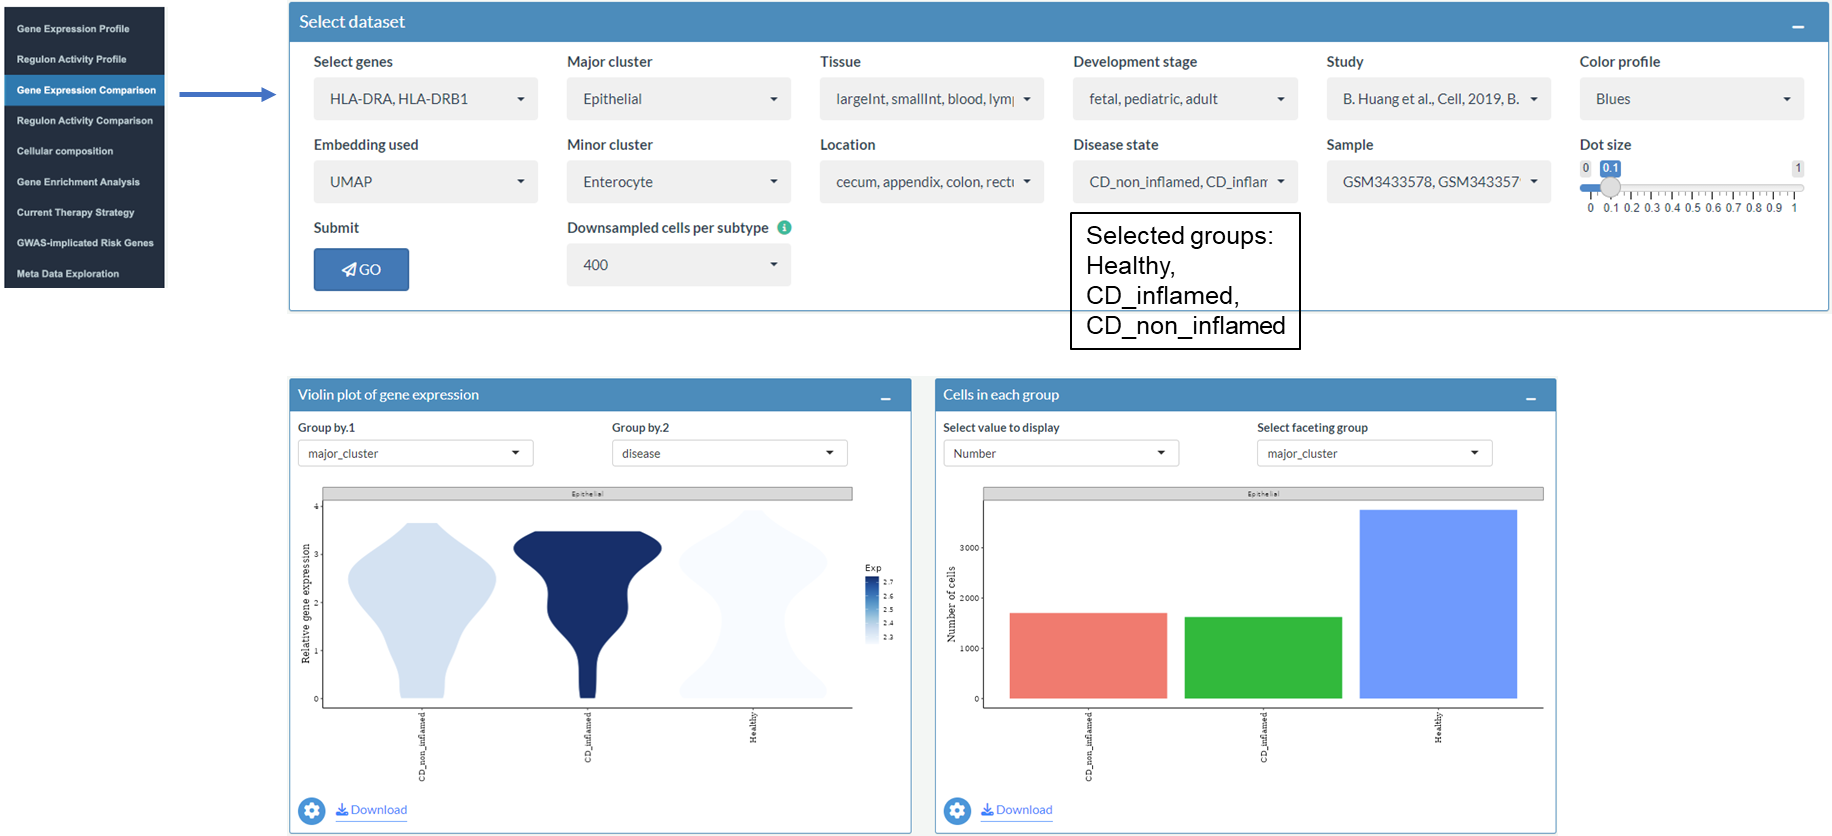
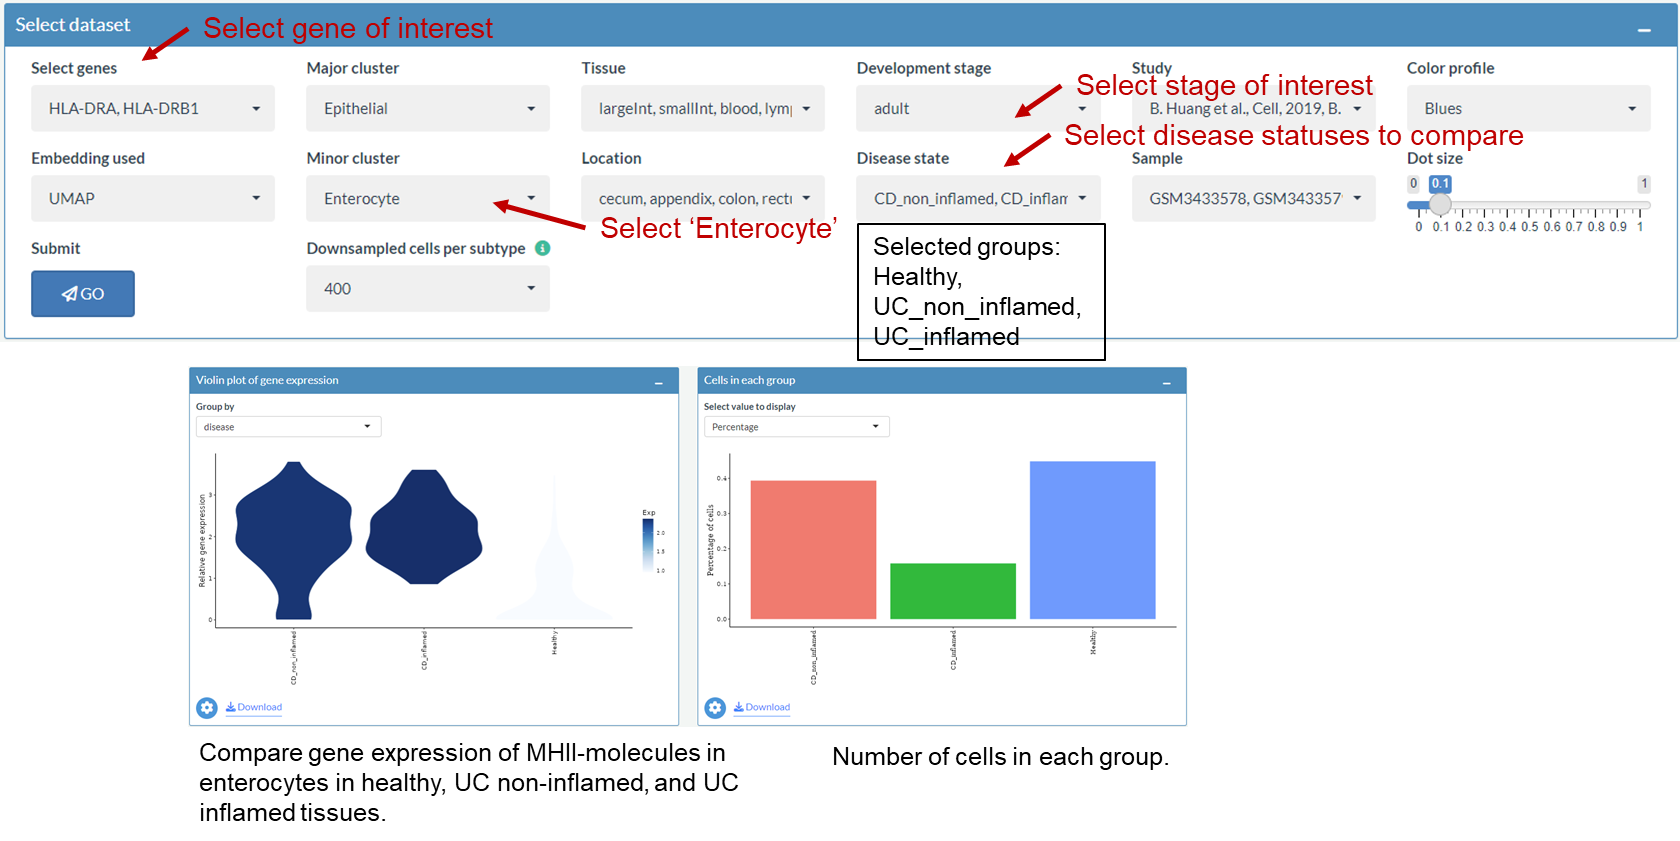
Compared to the control panel of the first two parts, several additional choices are provided for Gene Expression Comparison part, including Tissue, Developmental stage, Study, Minor cluster, Location, Disease state and Sample.
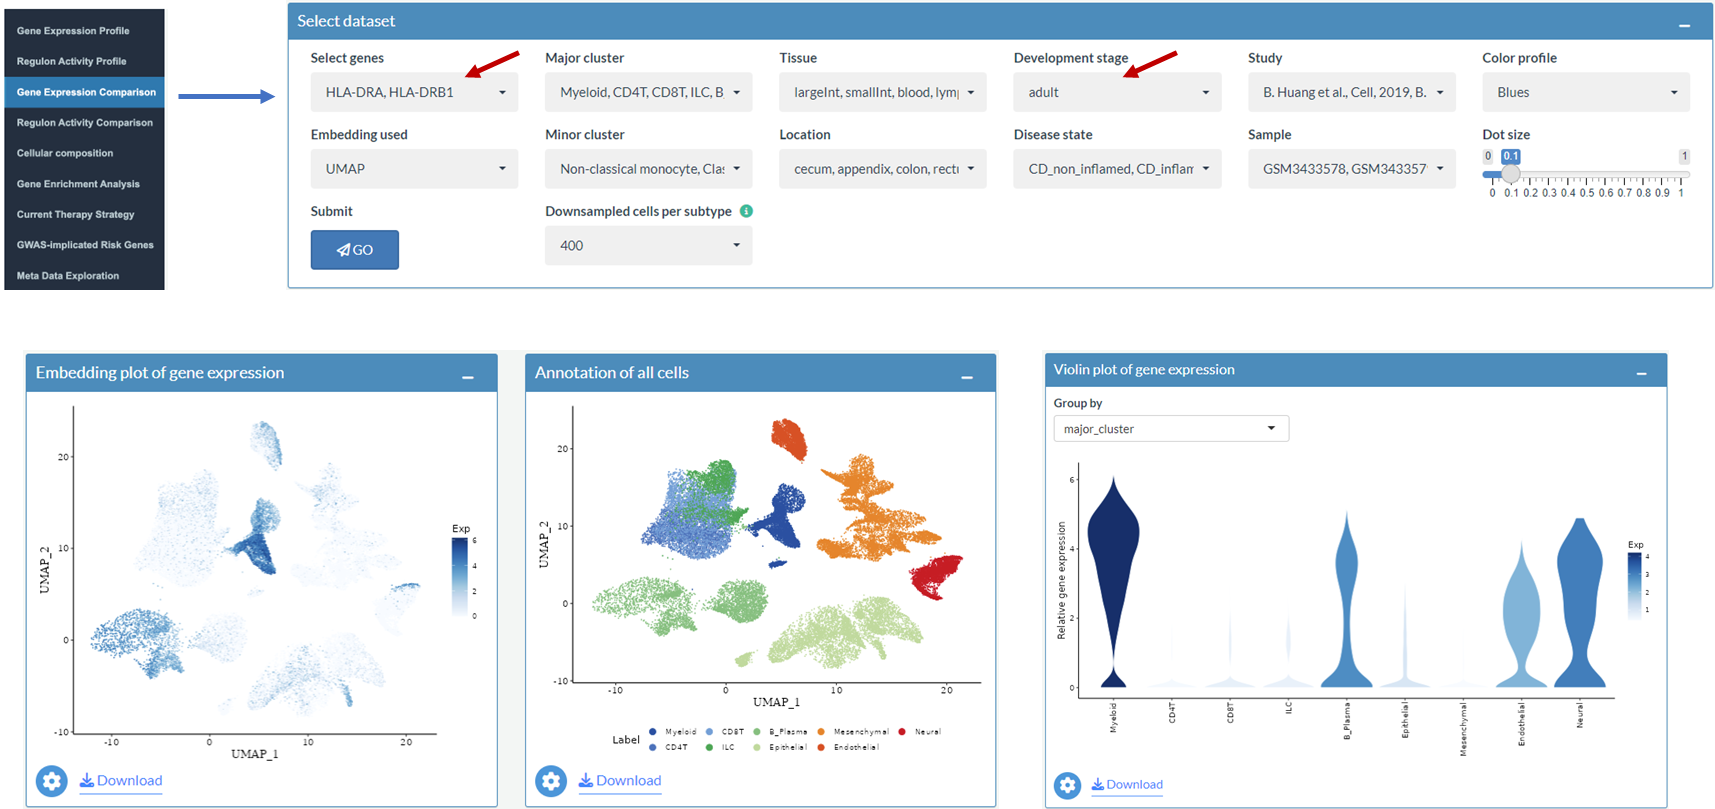
Example: Explore the gene expression of HLA-II molecules
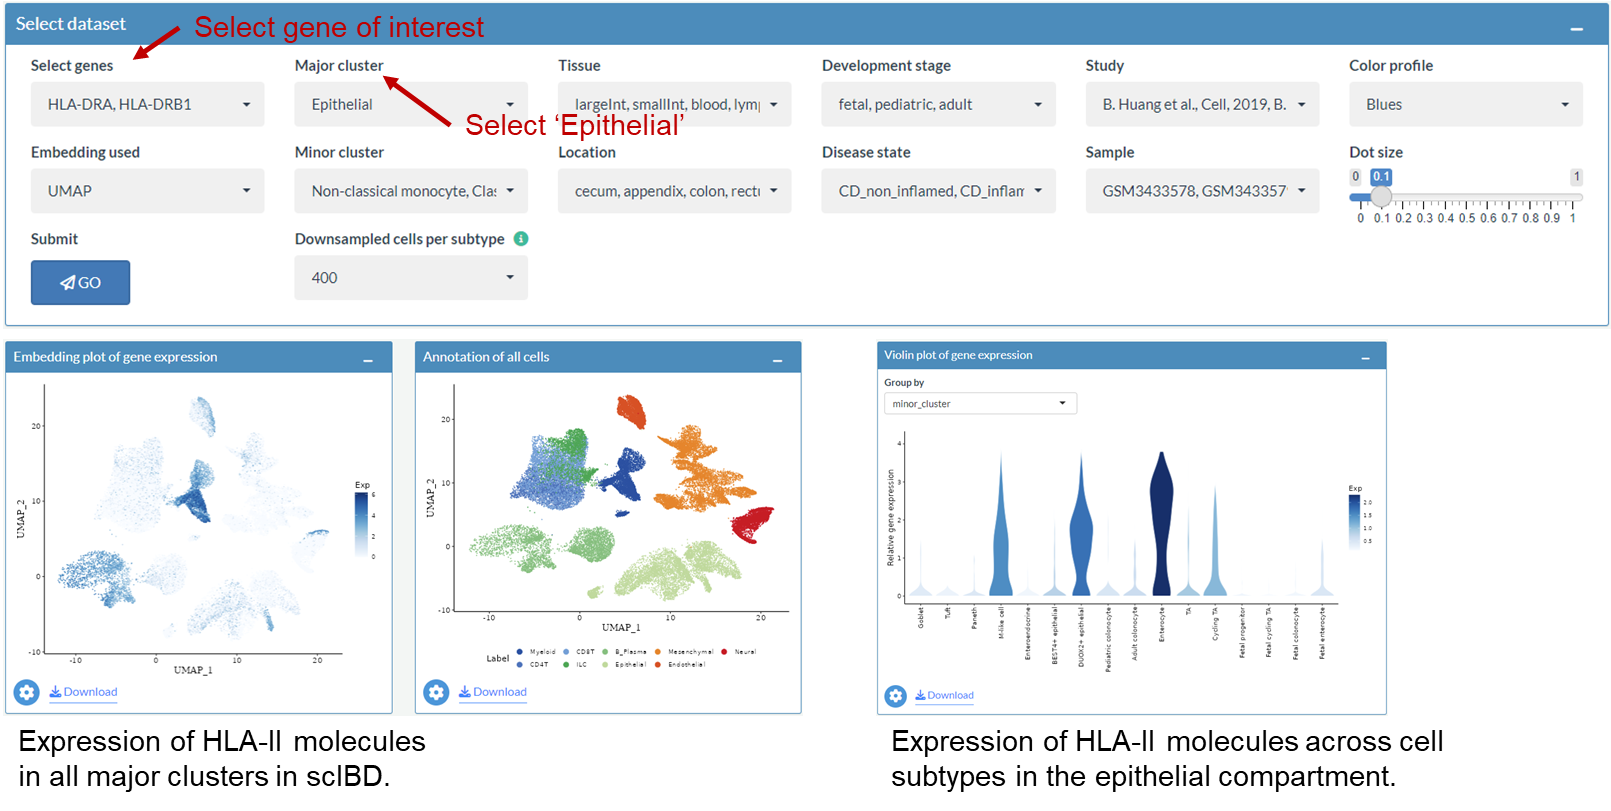
Explore the gene expression of HLA-II molecules in all major clusters
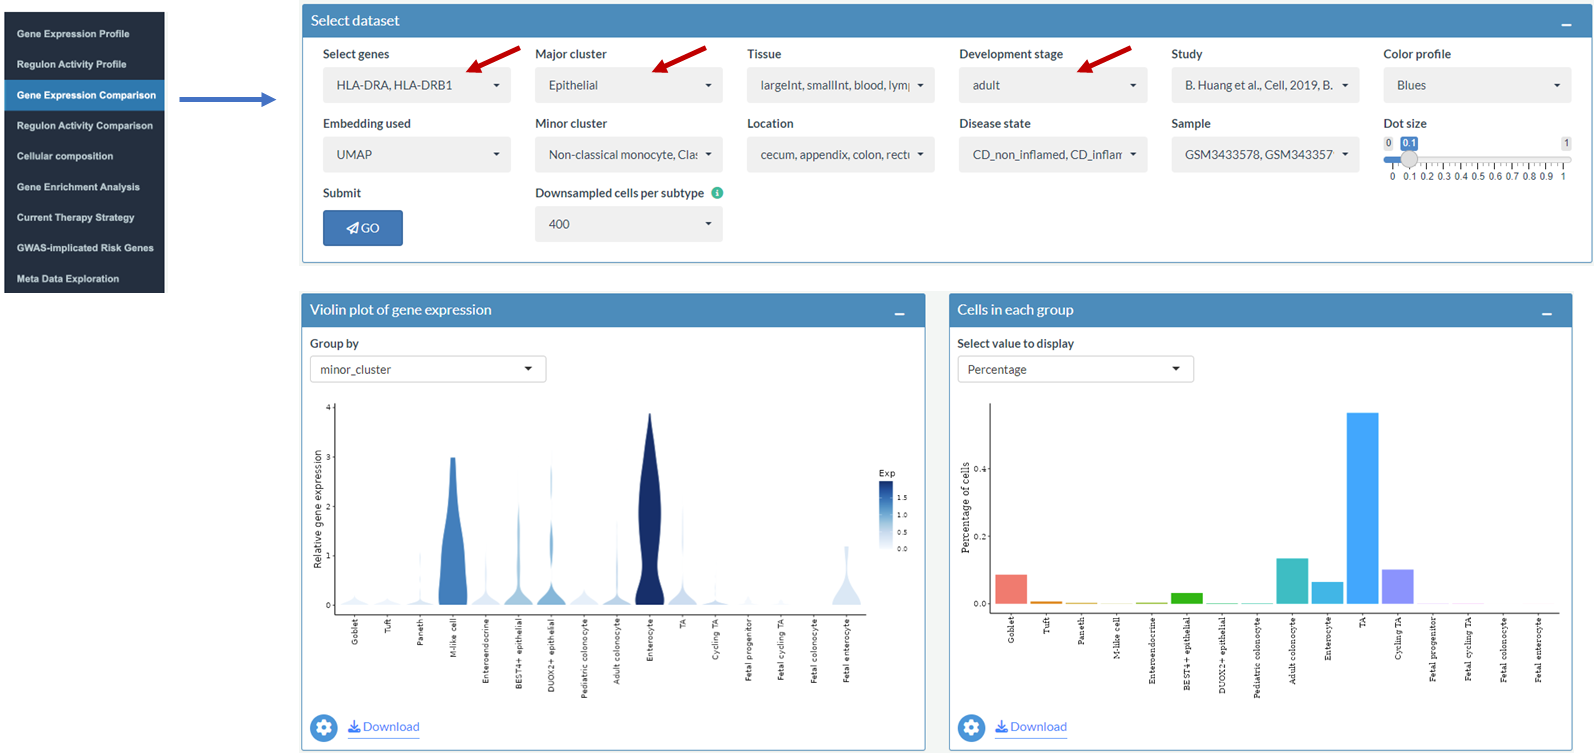
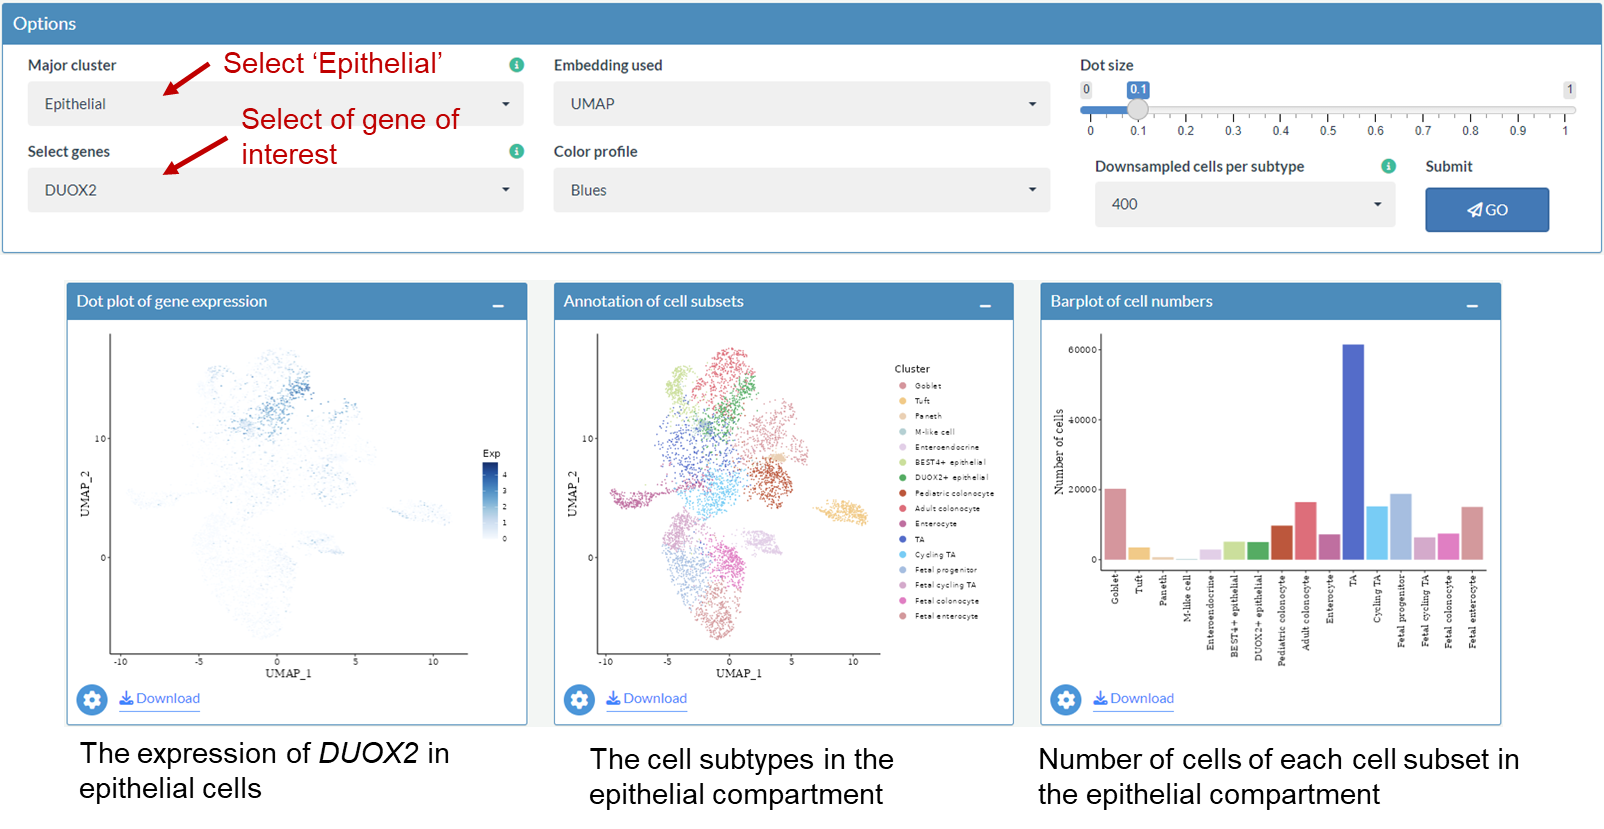
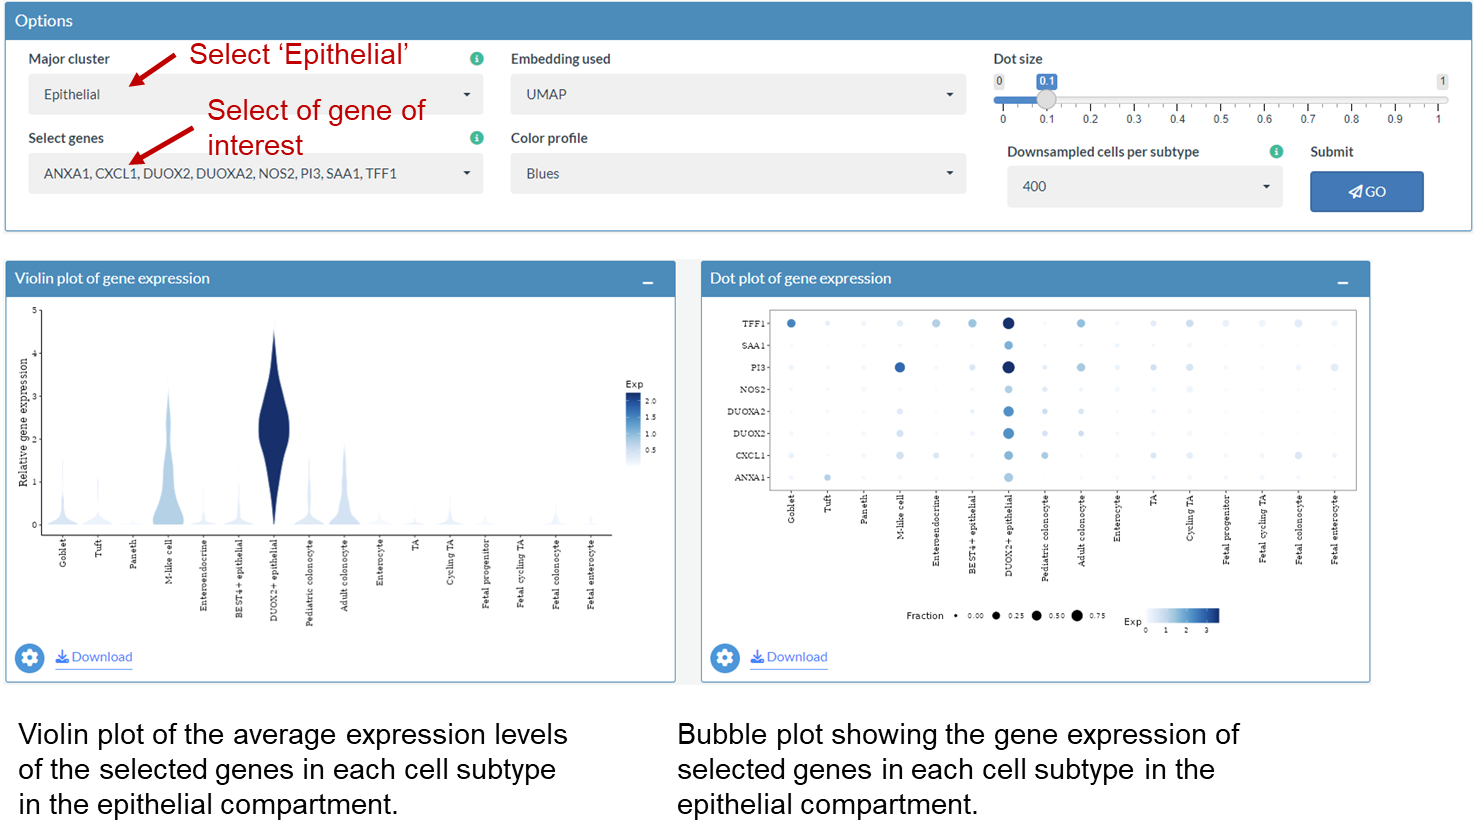
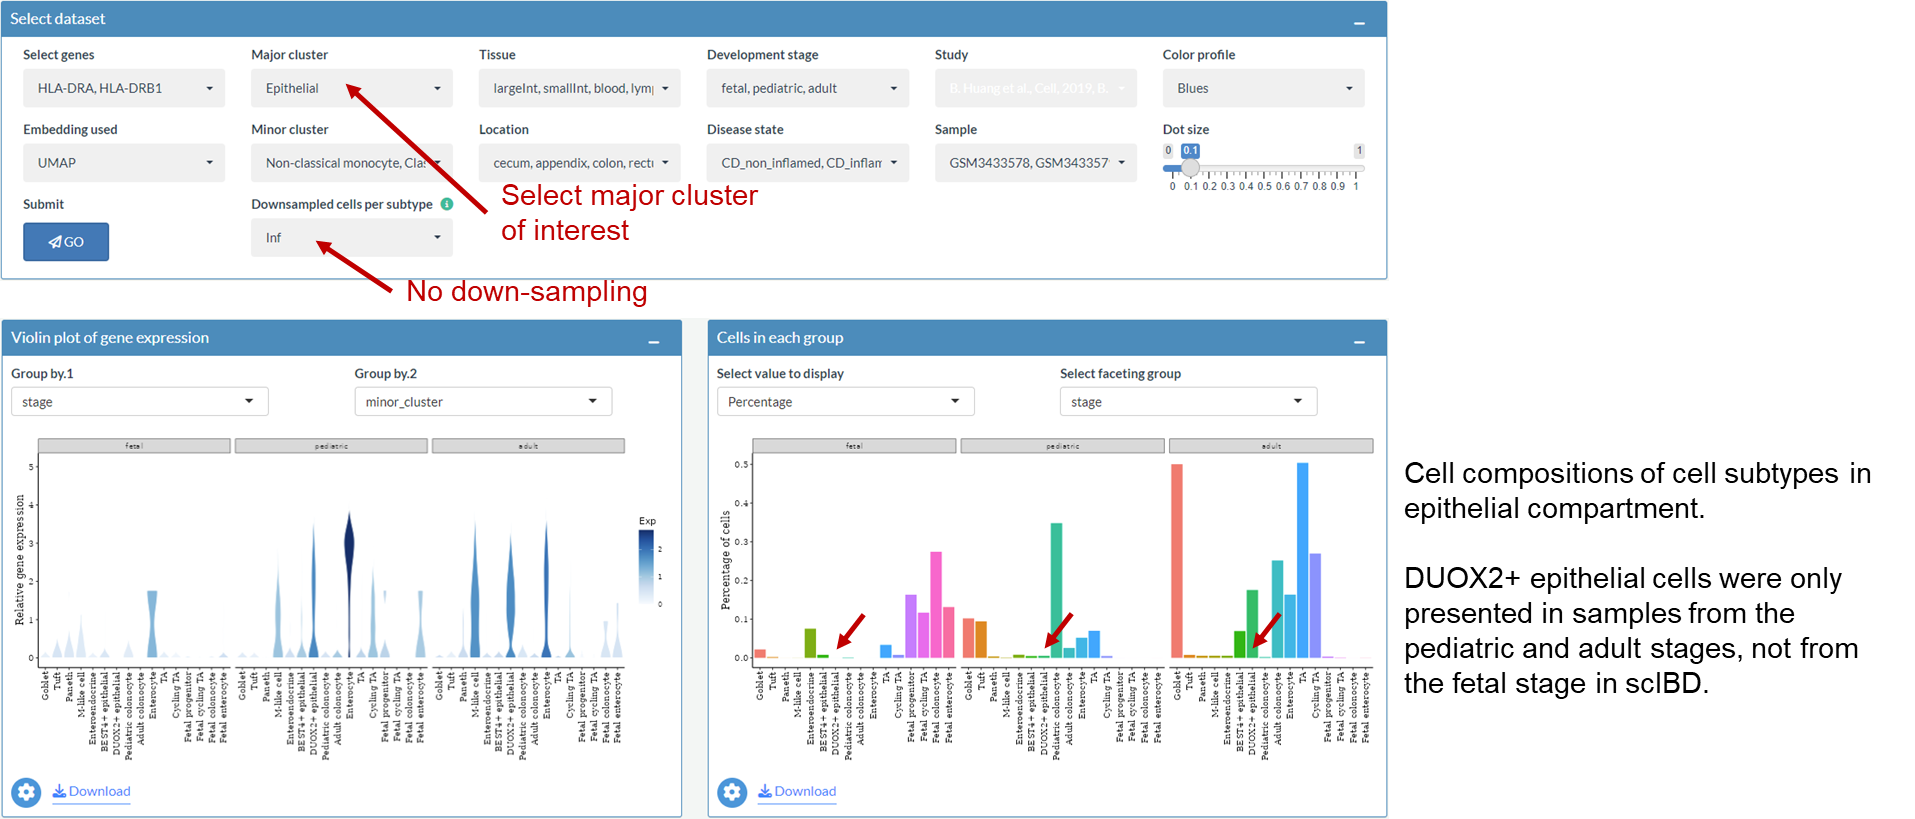
Explore the gene expression of HLA-II molecules in epithelial cells
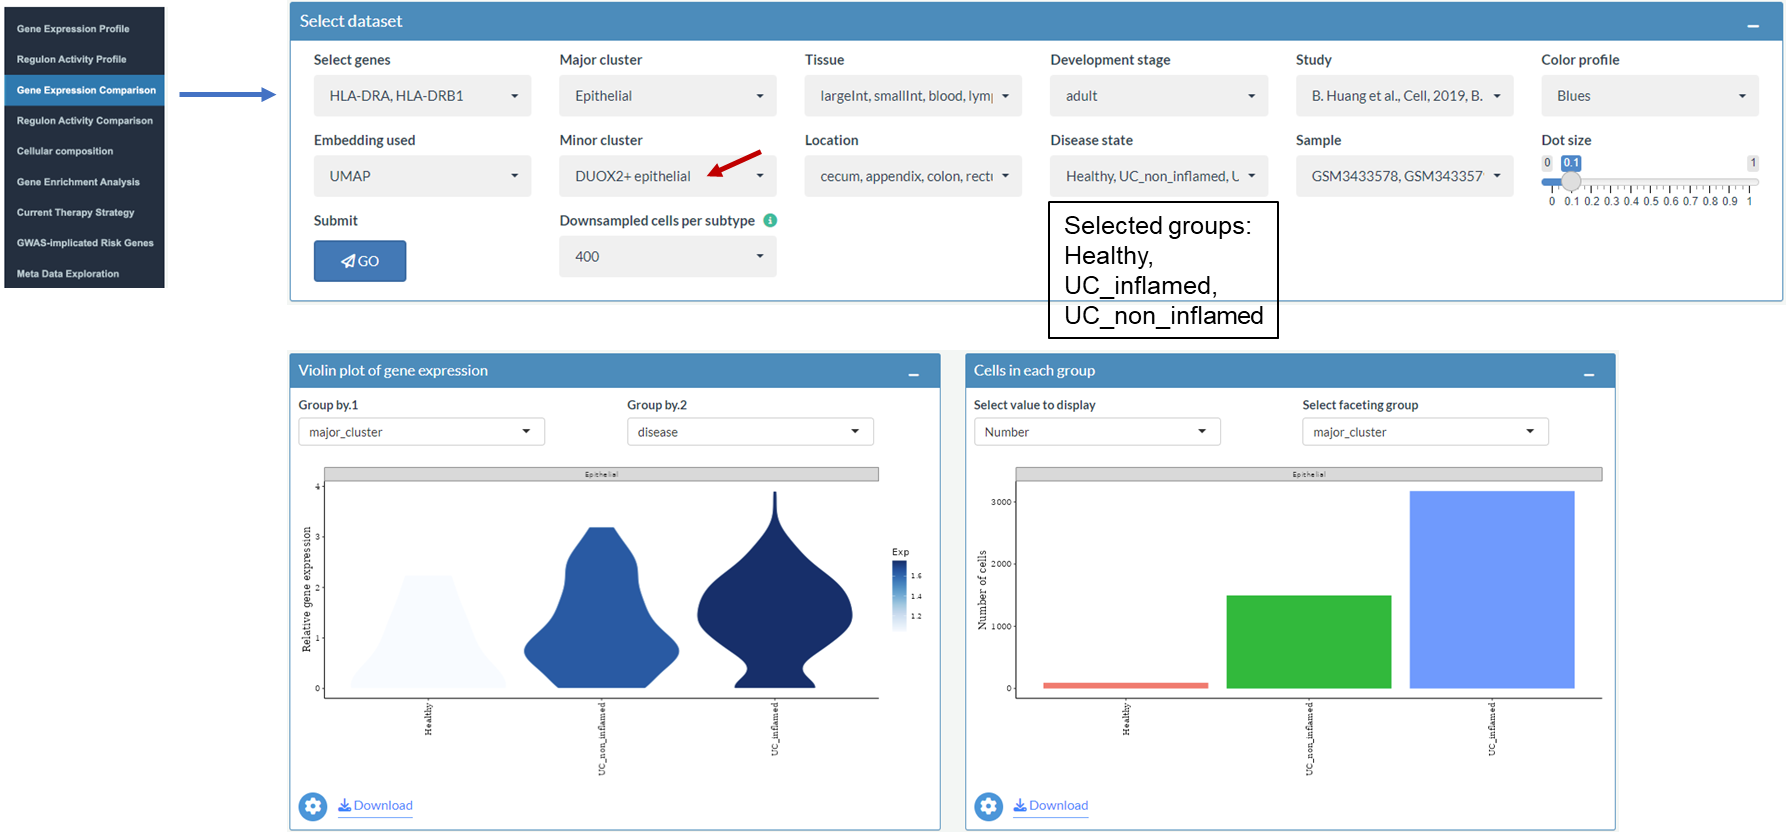
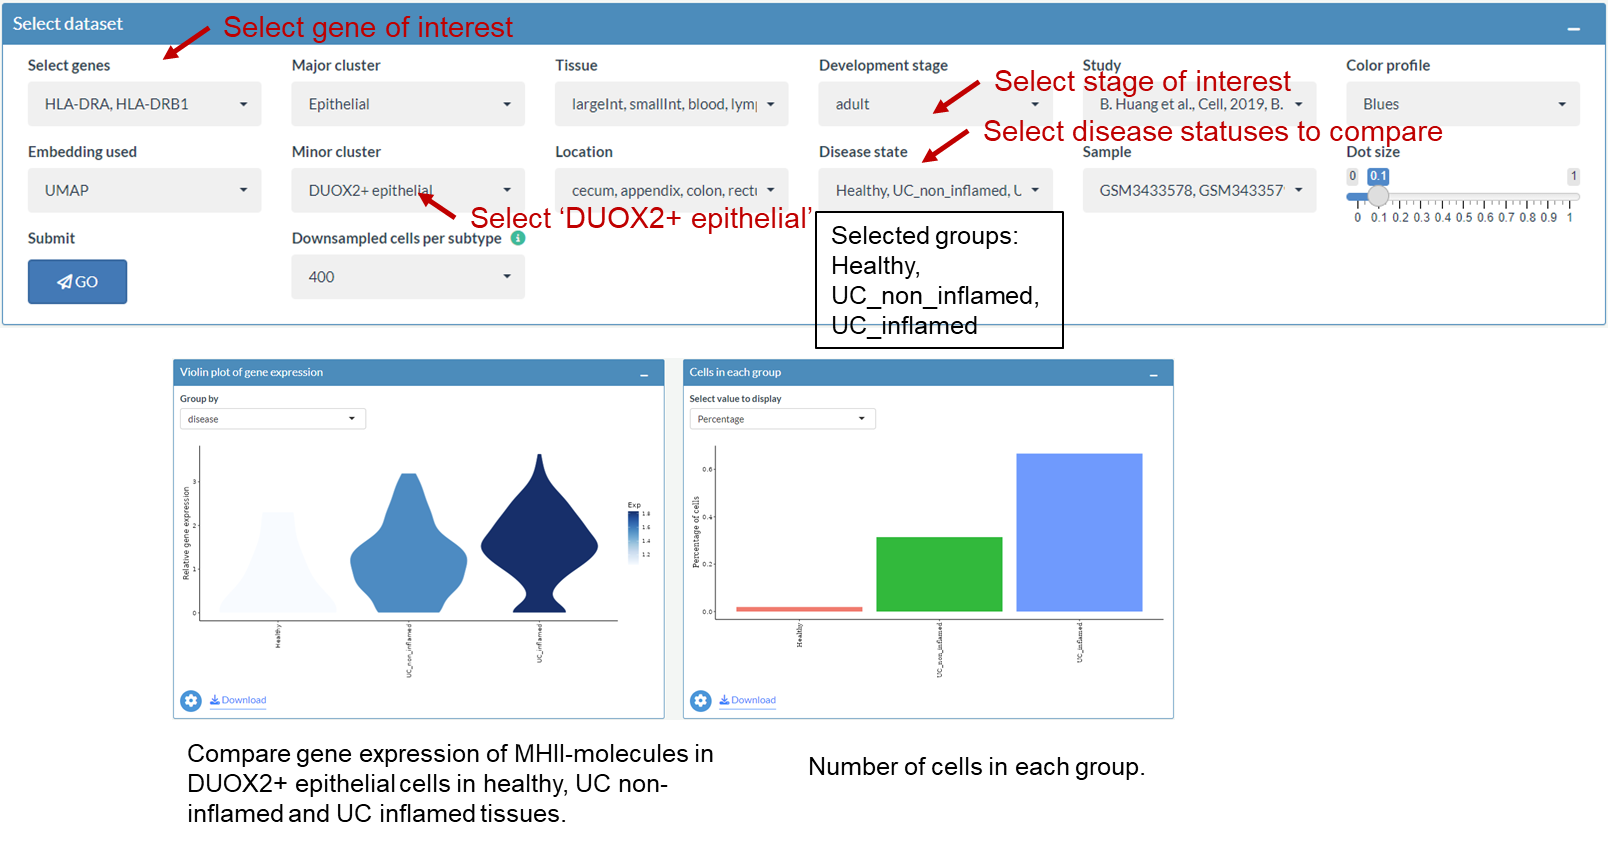
Compare the gene expression of MHC-II molecules between health and UC in DUOX2+ epithelial cells
Compare the gene expression of MHC-II molecules between health and CD in enterocytes
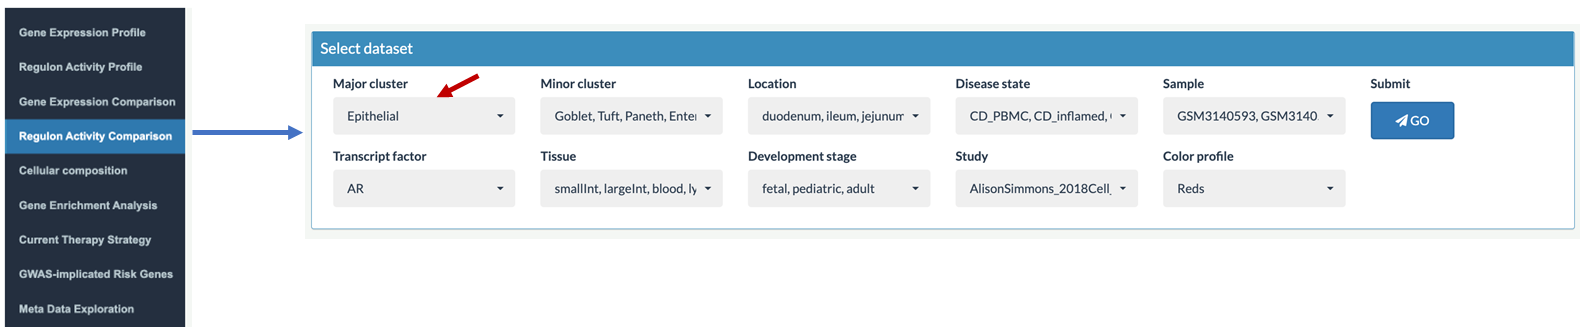
4. Compare regulon activity between healthy individuals and patients with IBD
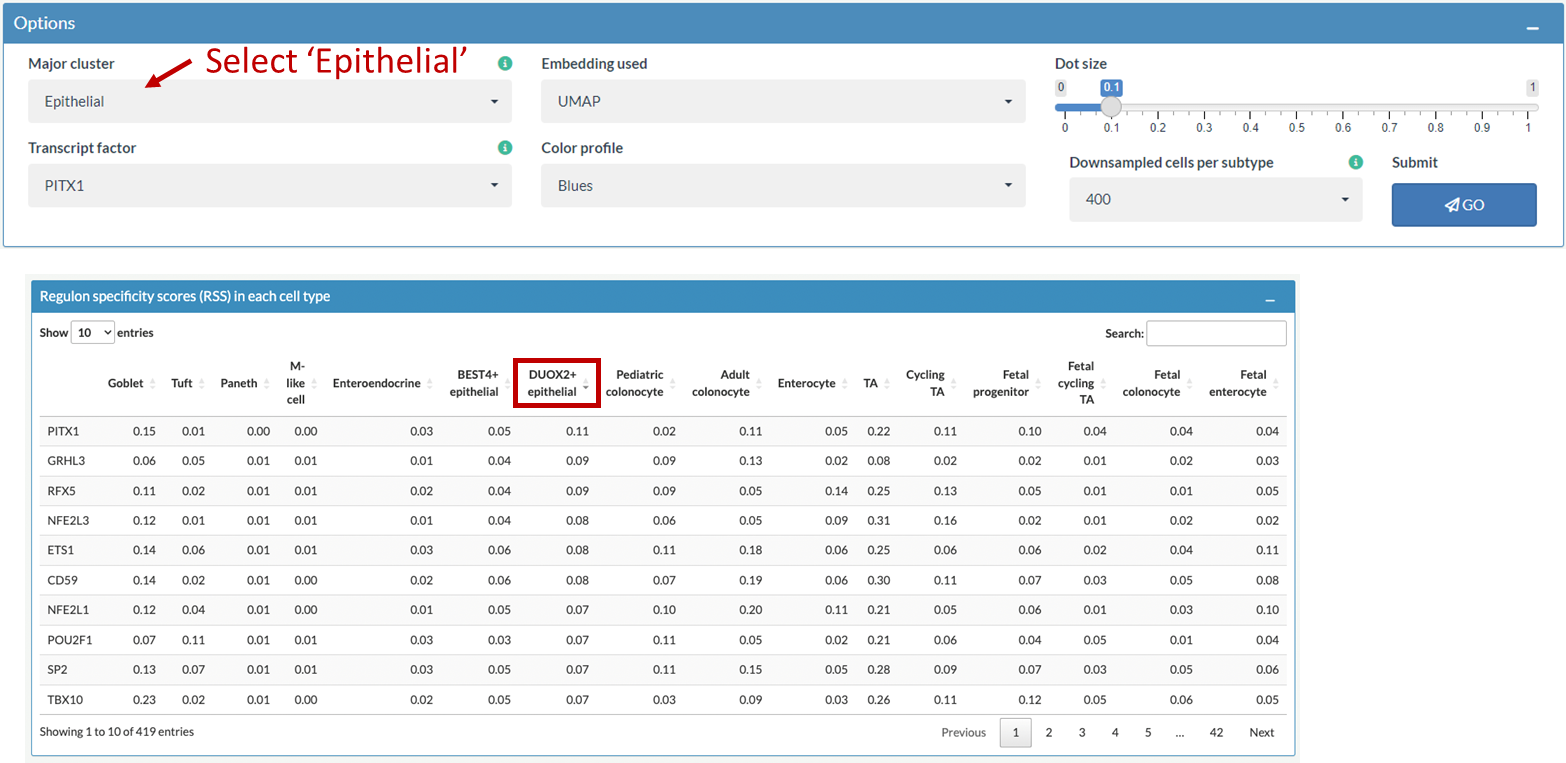
Example: Explore differentially activated regulons between health and UC or CD in epithelial cells
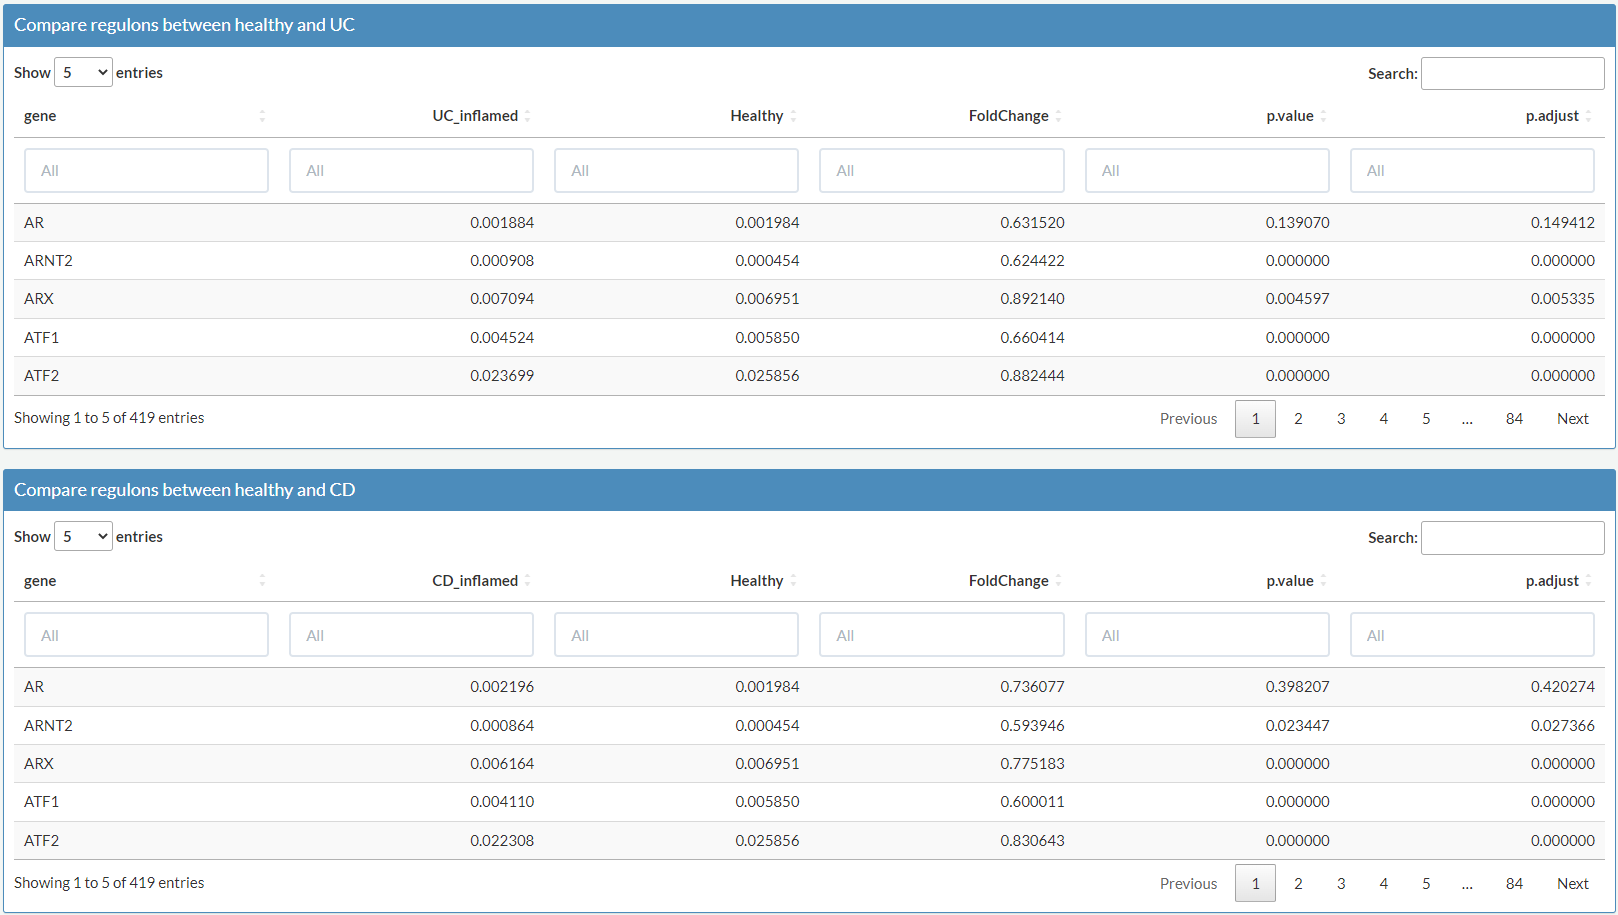
Select Epithelial as major cluster to explore differentially activated regulons (in this example, AR) between health and UC or CD in epithelial cells.
In the box of Compare regulons between healthy and CD (UC), the value in the second and the third column represents the average regulon activity in inflamed tissue of CD, UC patients or healthy individuals.
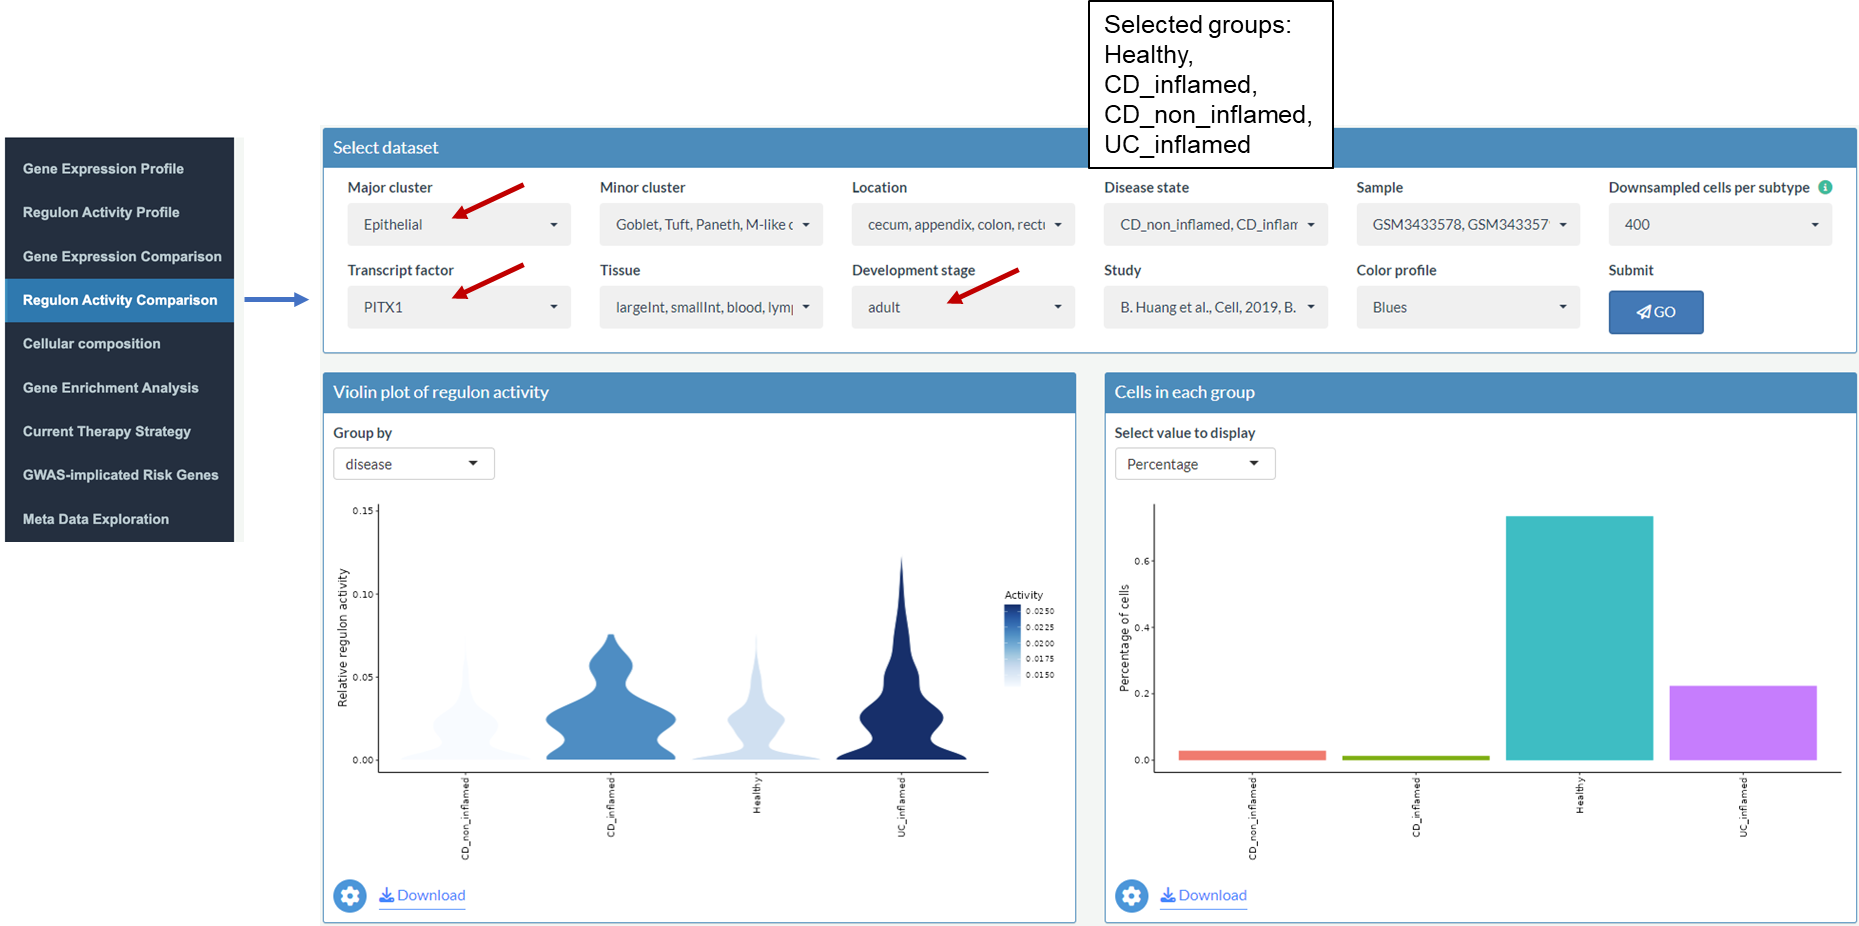
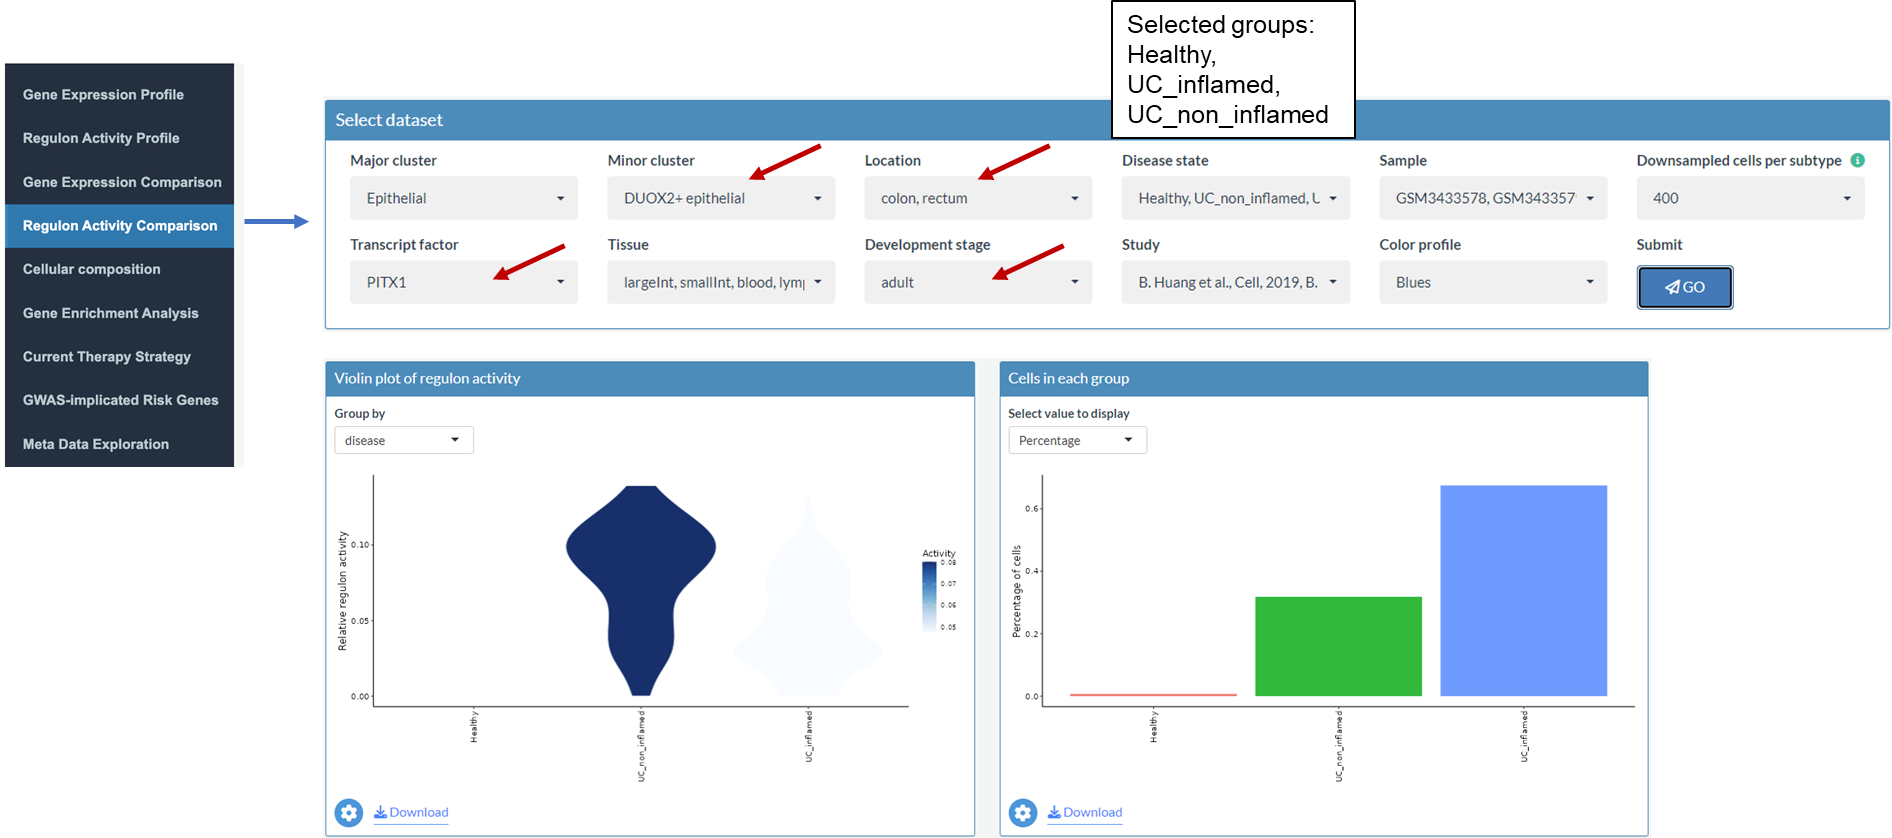
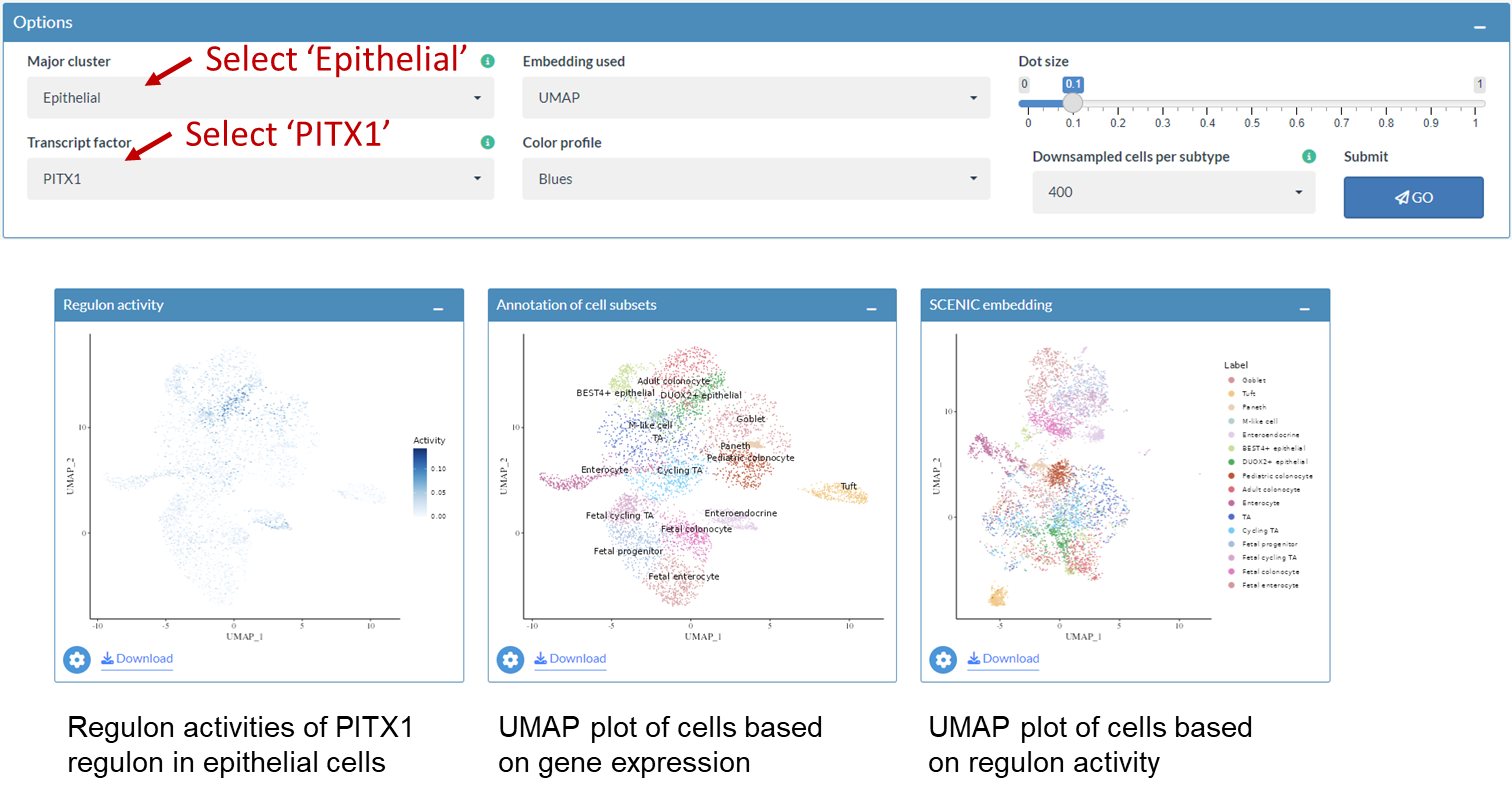
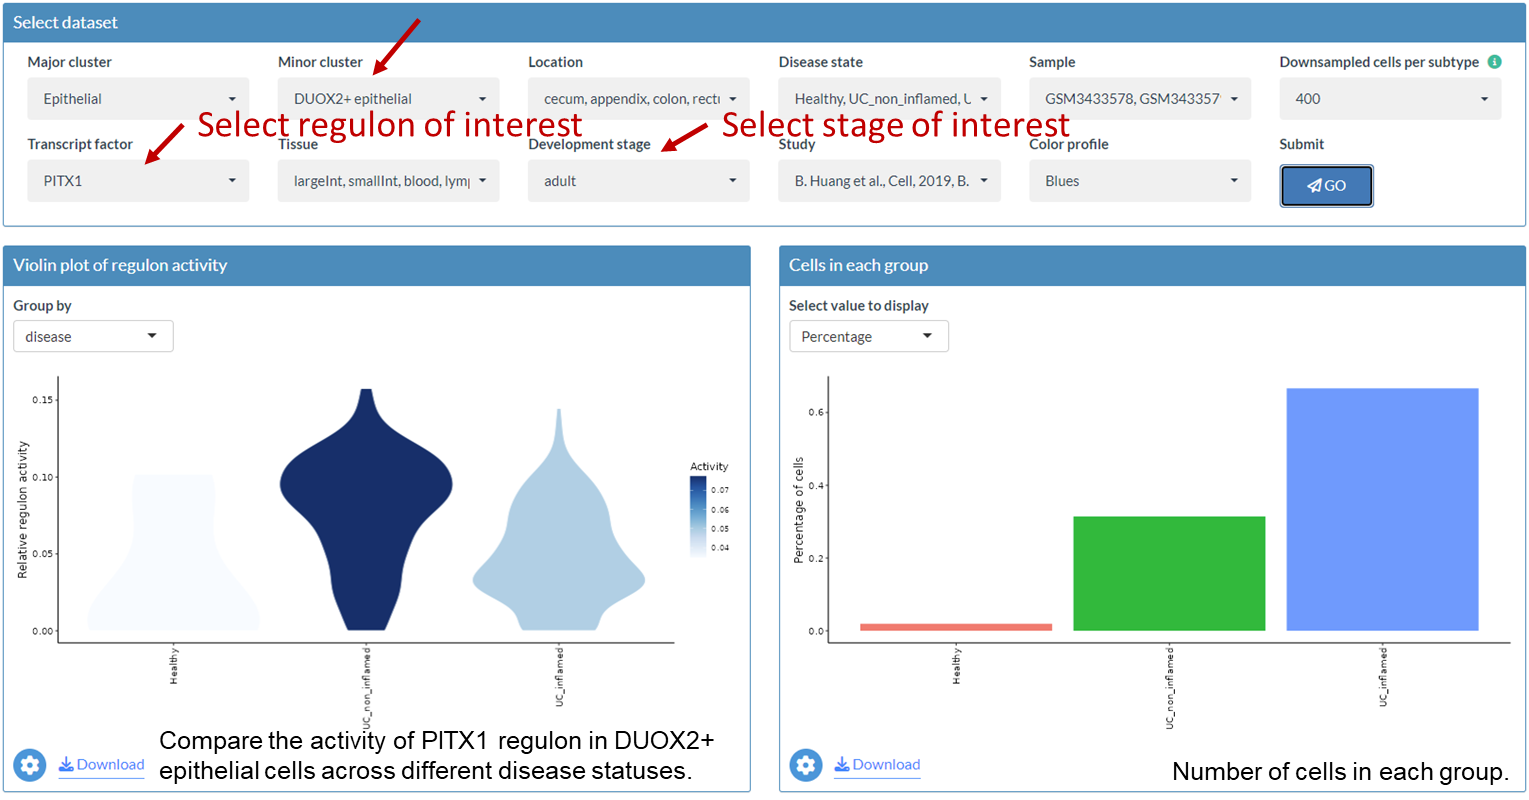
Example: Compare regulon activity of PITX1 between healthy individuals and patients with UC or CD in epithelial cells
Example: Compare regulon activity of PITX1 between healthy individuals and patients with UC in DUOX2+ epithelial cells in colorectum
Example: Compare regulon activity of PITX1 between colon and rectum in DUOX2+ epithelial cells in patients with UC
5. Apply gene set enrichment analysis
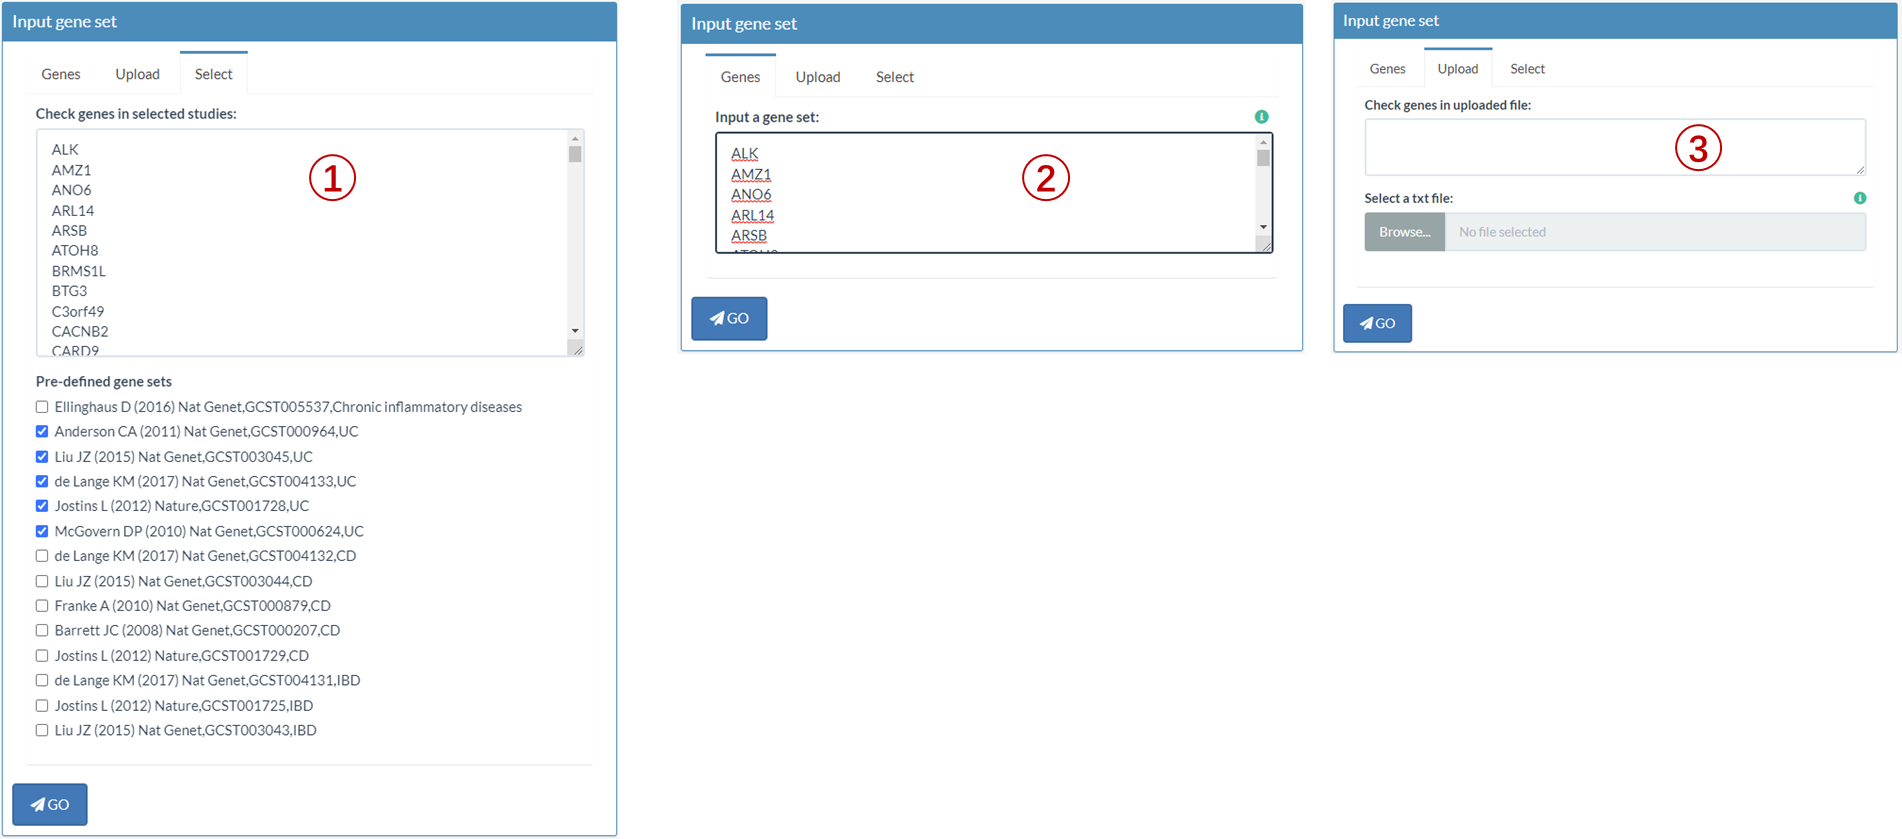
In the 'Gene Enrichment Analysis' panel, three ways to input a gene set are provided.
You can choose one or more pre-defined risk gene sets from different studies. Here, we choose all pre-defined risk genes of UC (1).After selection, gene list would be generated automatically in the box.
Similarly, you can define your interested gene set (2) in the same format (one gene per line) or upload a txt file (3) containing your gene set.
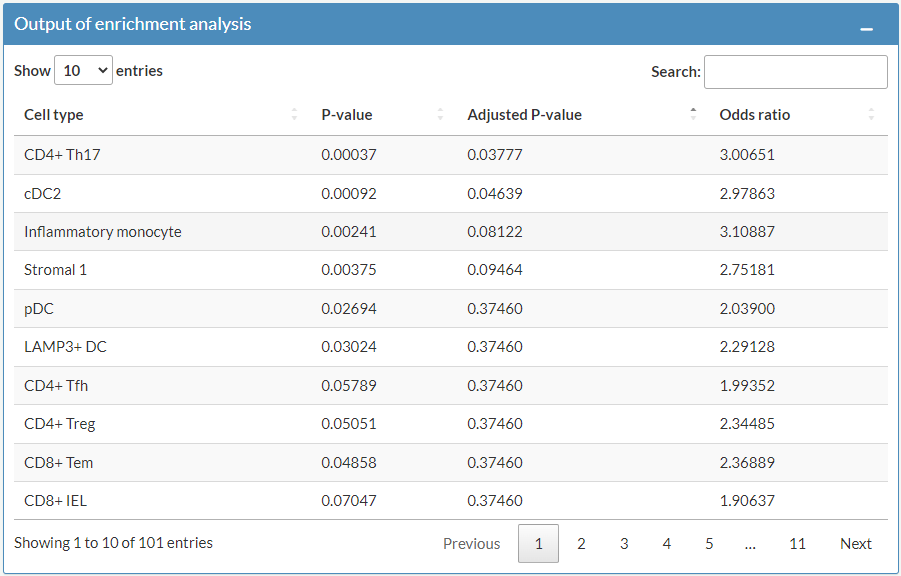
After applying gene set enrichment analysis on the risk genes of UC, the enrichment of them in each cell types are shown.
Odds ratio indicates how likely an outcome is to occur in one context relative to another.
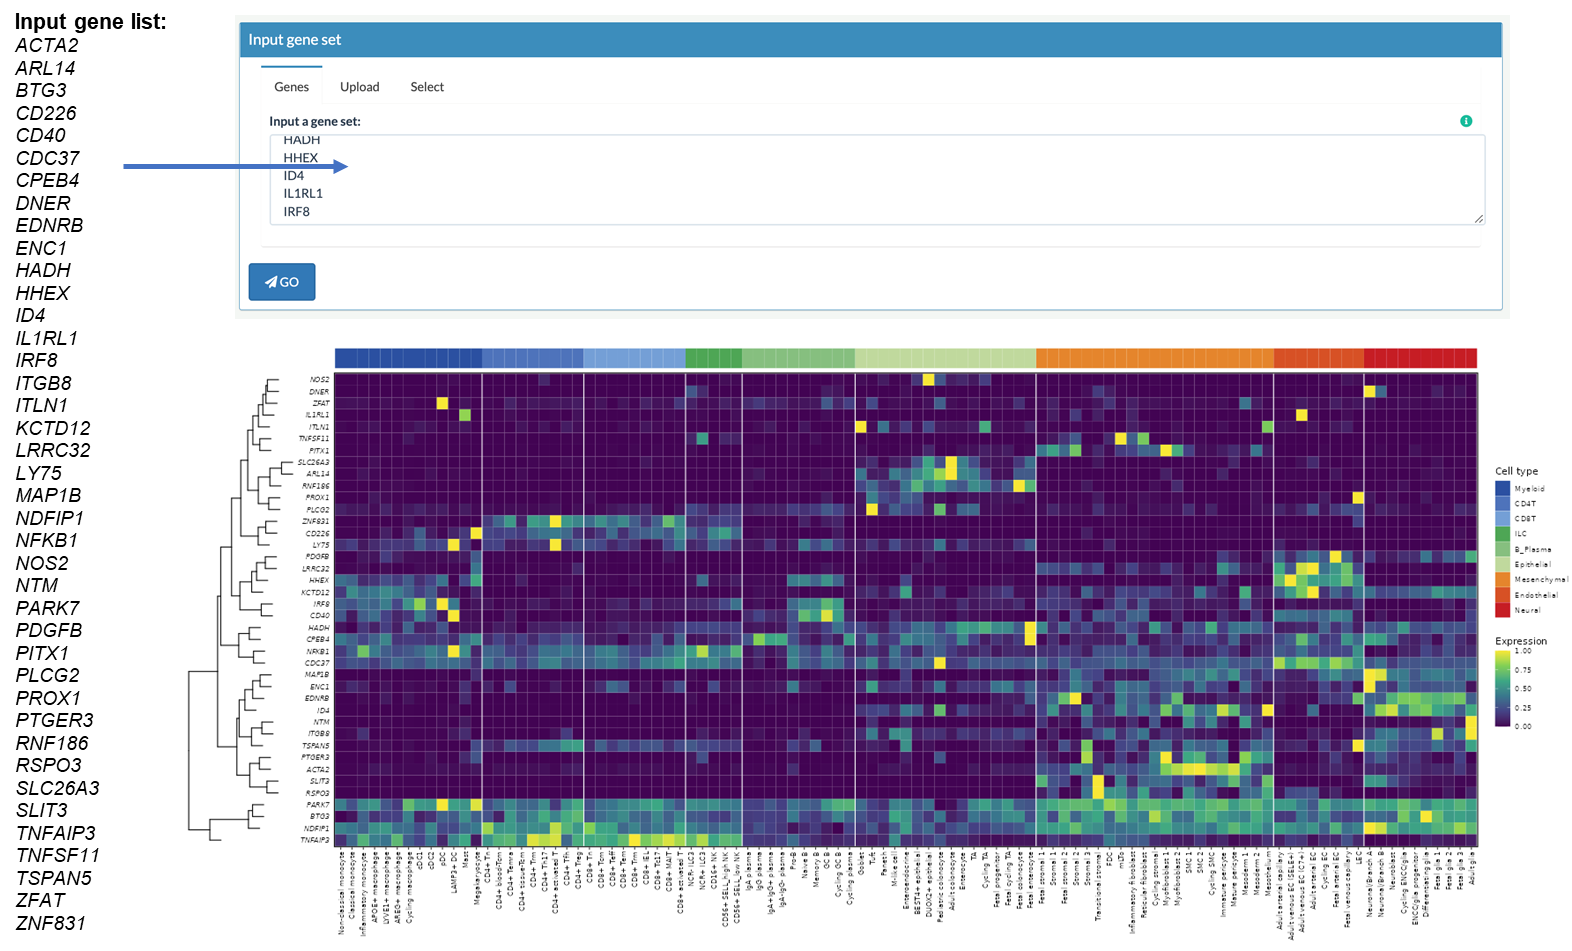
Heatmap to show gene expression of each GWAS-risk genes in each cell subtypes
Rows: genes Columns: cell subtypes Gene expresion are scaled by row.
6. Explore clinical trials, therapy drugs/targets, and GWAS-risk genes of IBD
The purpose of the section 'Current Therapy Strategy' in 'Resources' is to provide a summary of therapy targets, drugs, and relevant clinical trials for IBD. Here, users can search for clinical trials by disease type (e.g. Crohn's disease, ulcerative colitis), therapy type (e.g. biologics, small molecules), or therapeutic target genes. The results of the search will include a list of clinical trials that match the specified criteria, along with the therapy type and target gene for each trial.
Two parts are included in this section:
FDA approved drugs for IBD
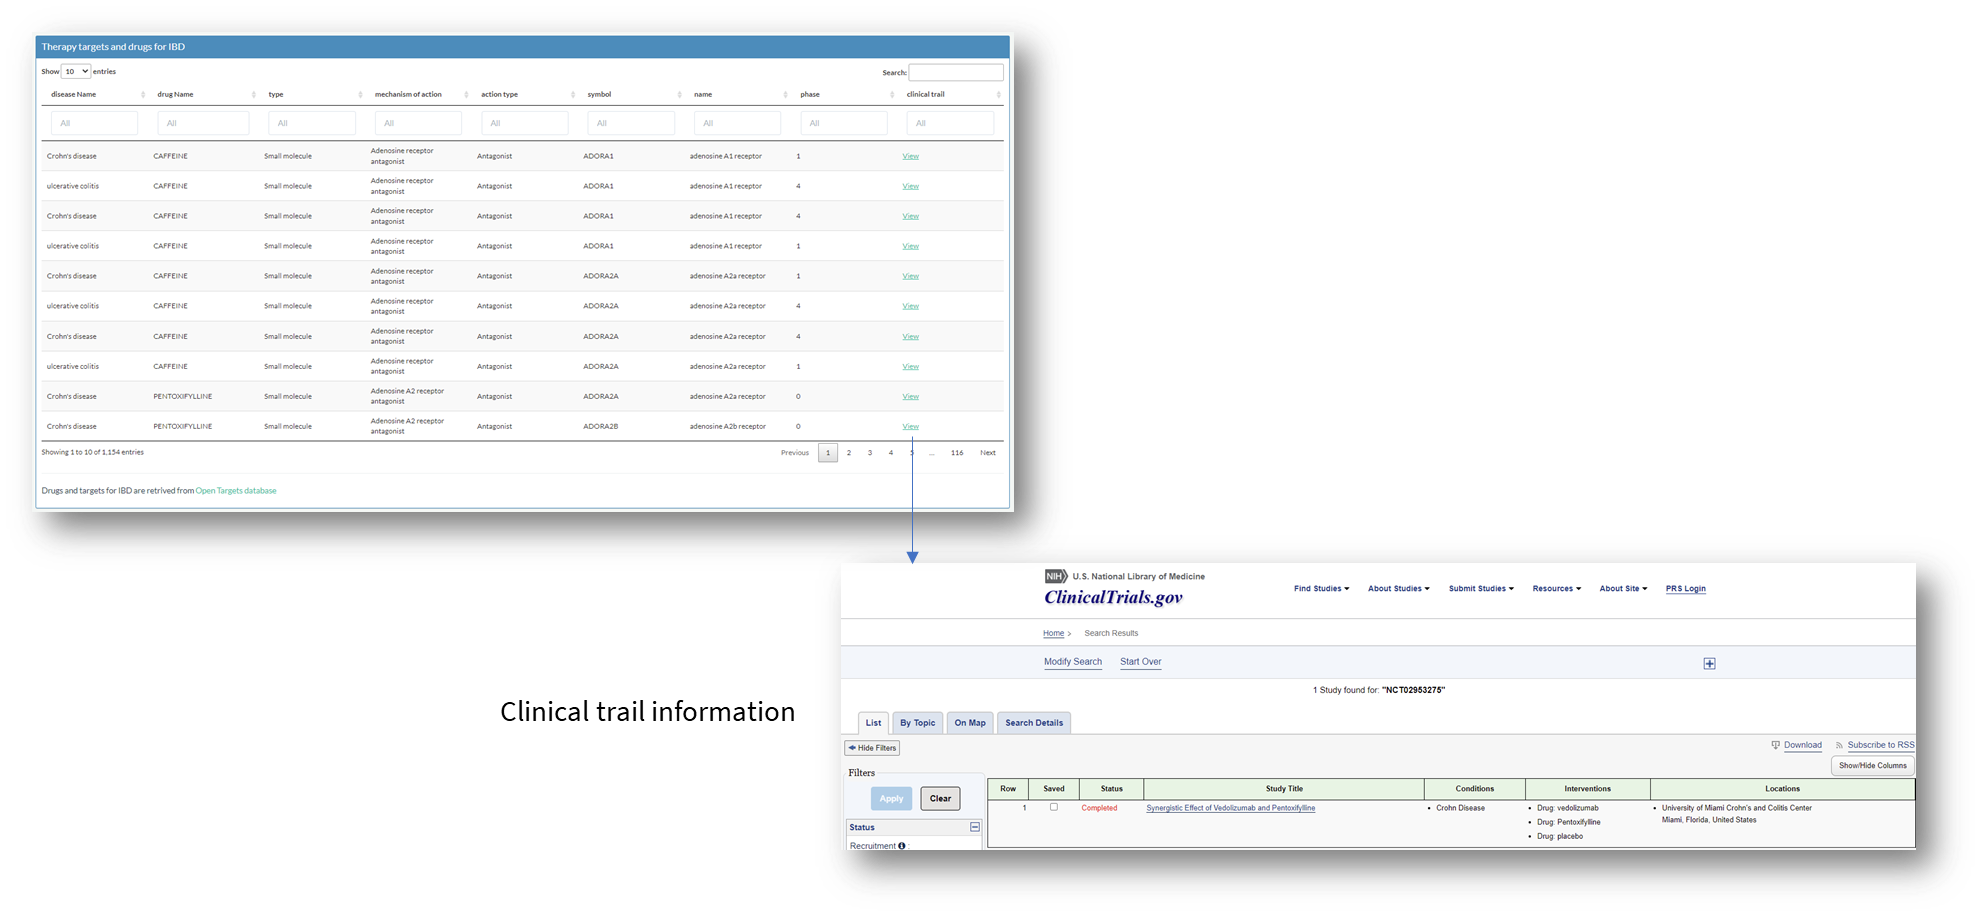
Therapy targets and drugs for IBD
Explore clinical trials of IBD
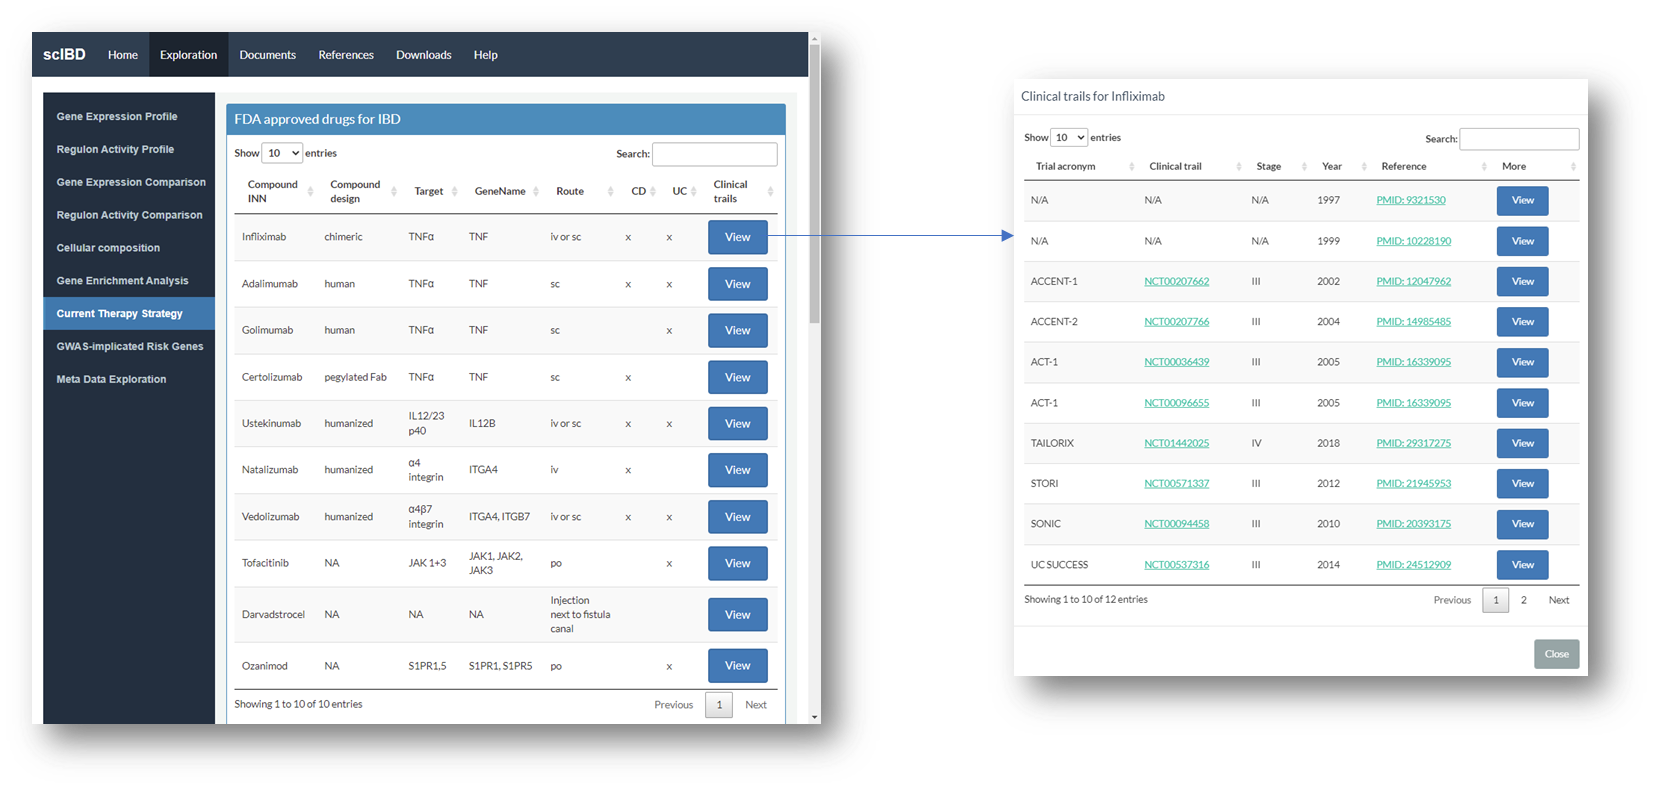
You can explore FDA approved drugs in the 'Current Therapy Strategy' panel.
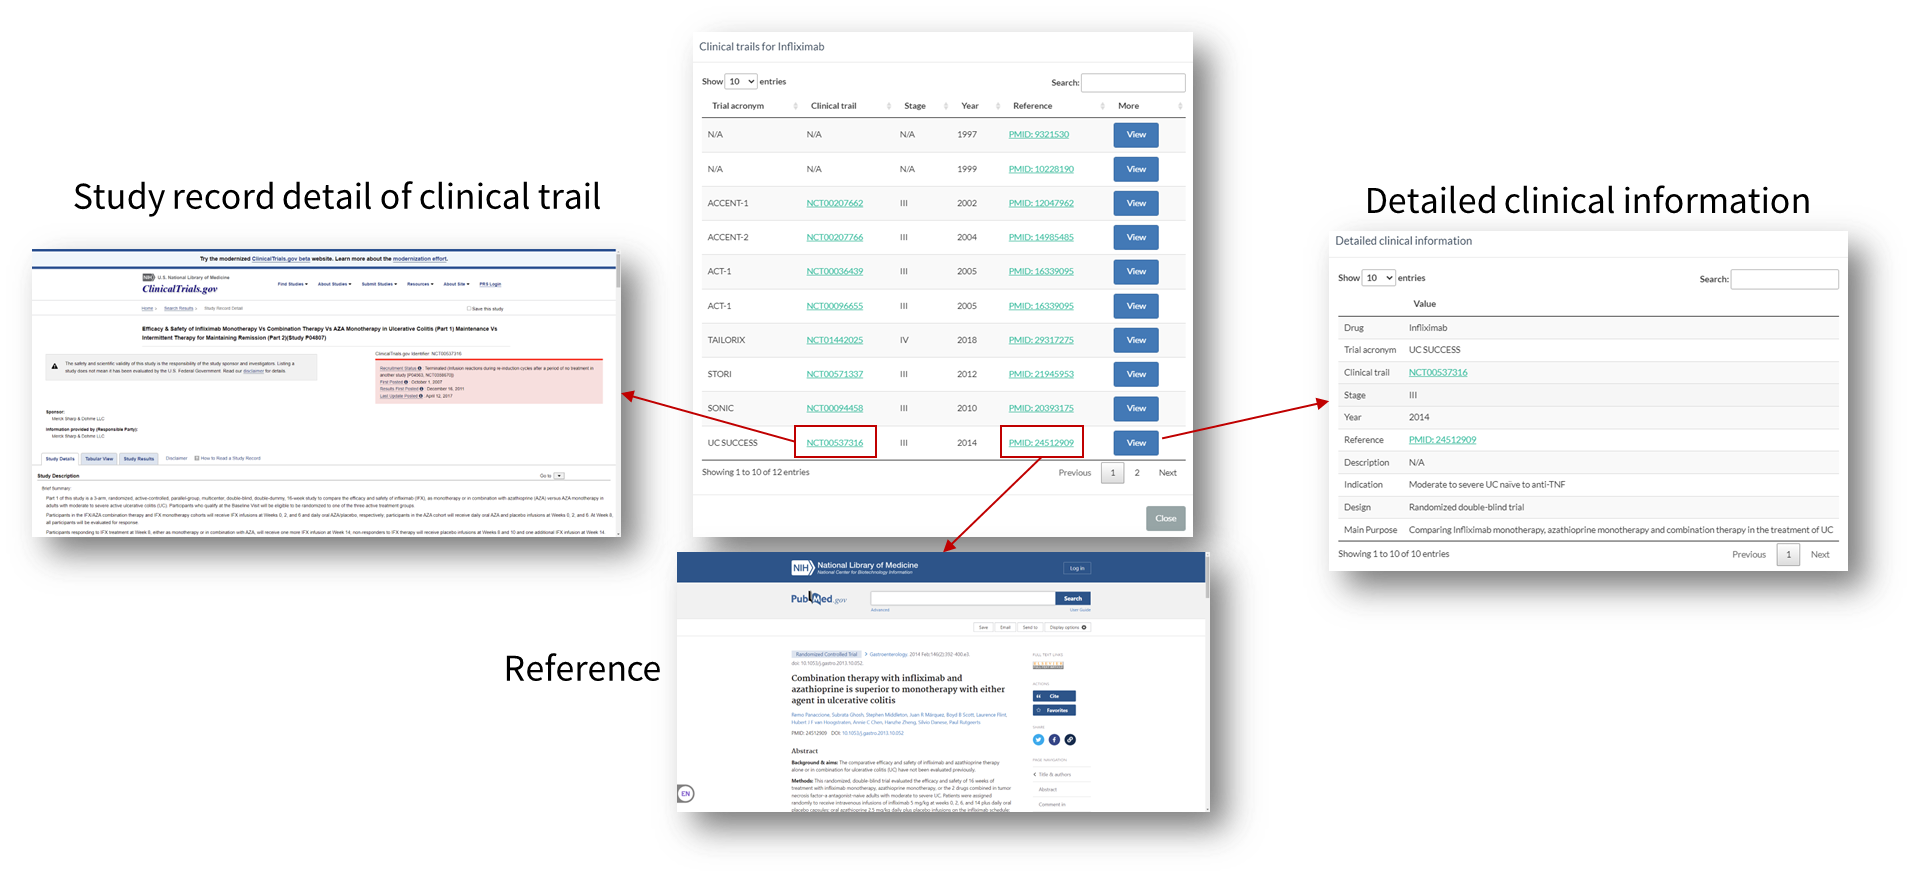
Clinical trial information can be reached through the 'View' button.
The clinical trail information for each drug includes the clinical stage, year of publishment, and links for study record of clinical trail, PubMed page for the reference and more detailed clinical information.
You can also explore drugs or targets under clinical trials in this tab. Click 'View' button for clinical trail information.
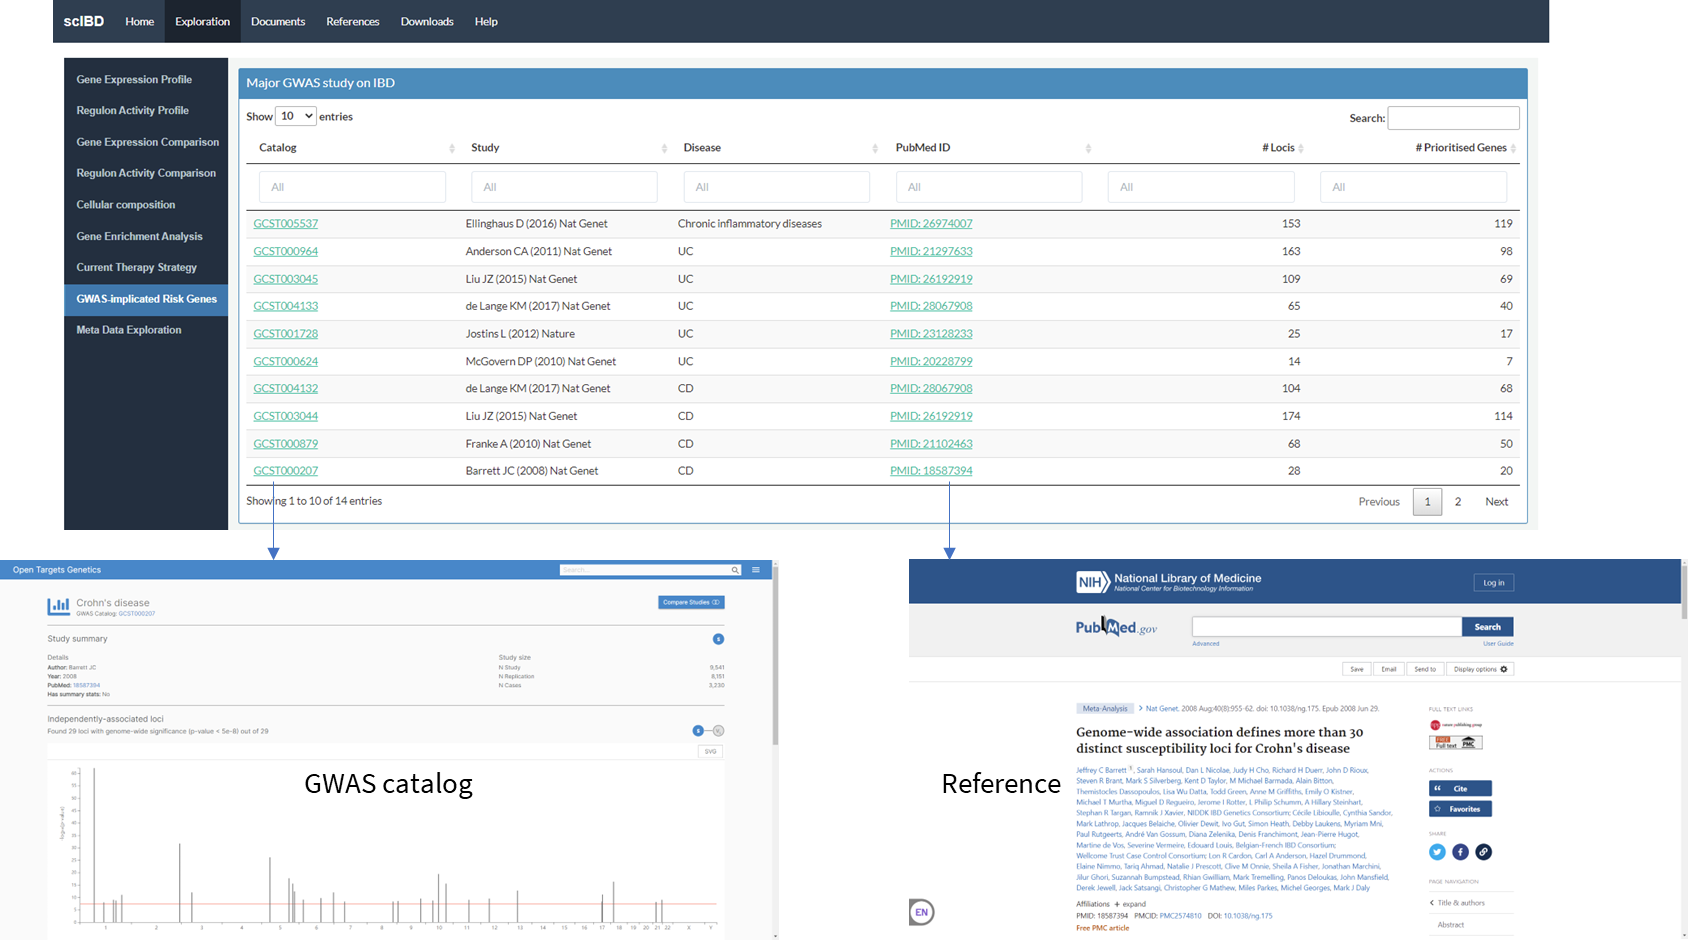
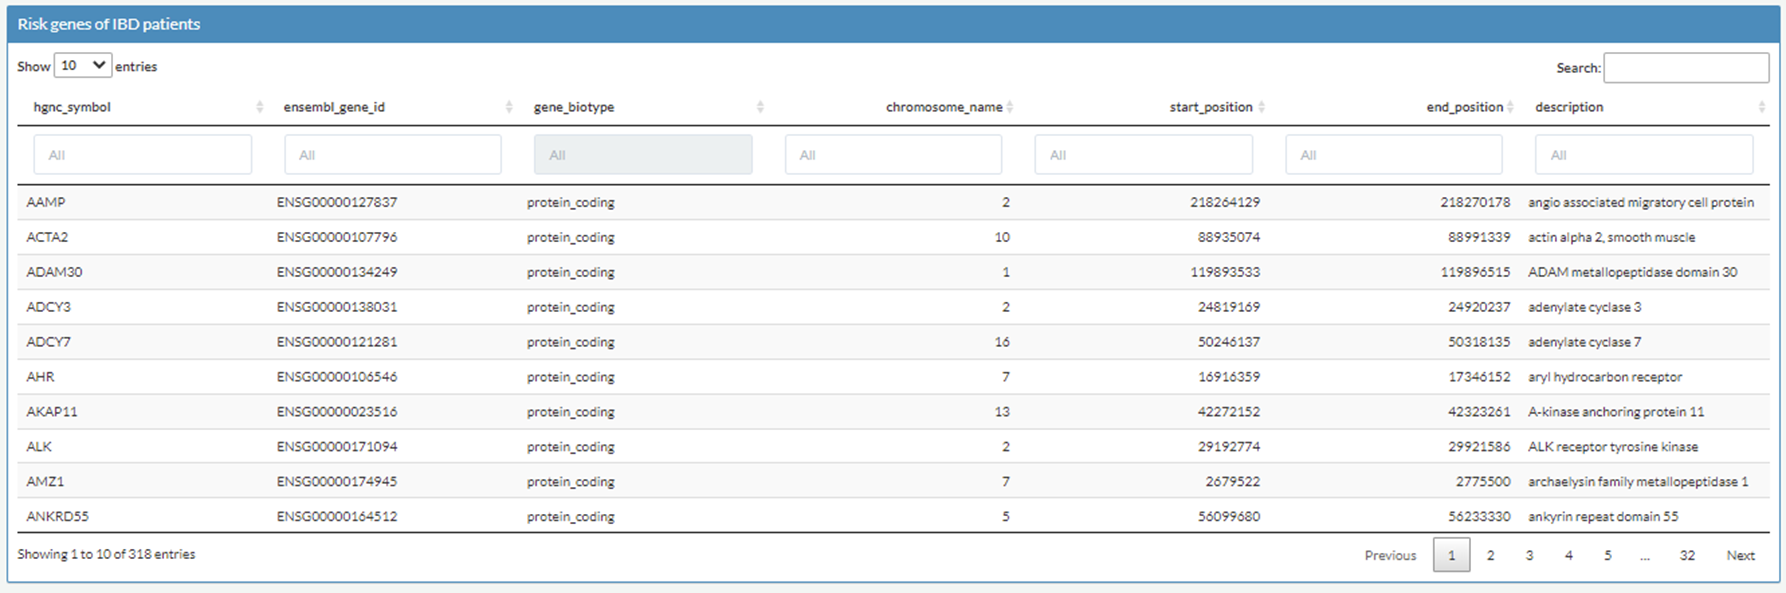
You can also explore GWAS-risk genes of IBD in 'GWAS-implicated Risk Genes' tab.
The risk genes of audlt IBD were retrieved from these studies listed in the table of 'Major GWAS study on IBD'
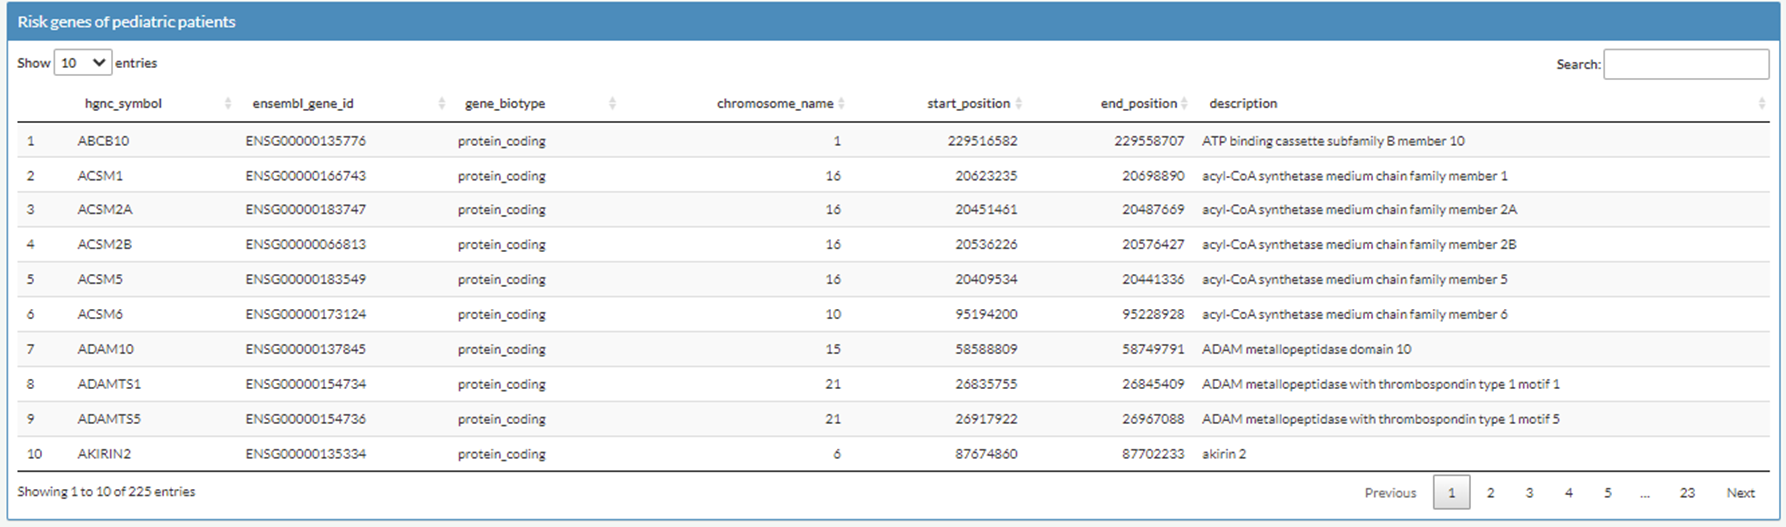
The risk genes of pediatric IBD were retrieved from this paper:
B. Huang et al., Mucosal profiling of pediatric-onset colitis and IBD reveals common pathogenics and therapeutic pathways. Cell 179, 1160-1176 e1124 (2019).
Browse the recently published datasets studying IBD
FAQ
Q1: What is scIBD?
scIBD is a platform for single-cell meta-analysis of inflammatory bowel disease (IBD) that
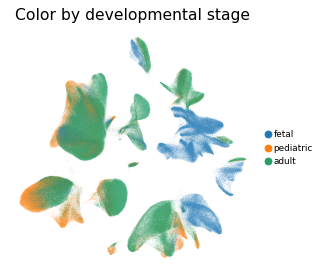
contains ~1.14 million single cells from 12 datasets across multiple development stages (including fetal, pediatric, and adult),
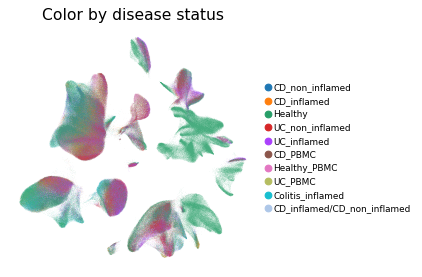
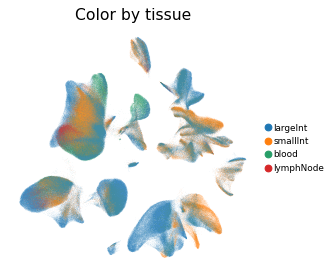
tissues from multiple anatomical regions (includign blood, small intestine and large intestine, etc.) and different disease states (healthy, inflammed UC, inflammed CD, etc.).
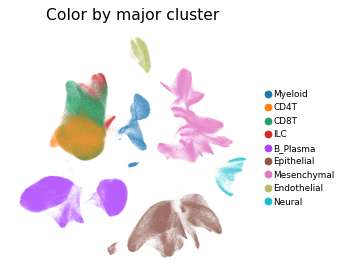
scIBD comprises 9 major subtypes (Myeloid, CD4 T cells, CD8 T cells, ILCs, B/Plasma cells, Epithelial cells, Mesenchynal cells, Endothelial cells, and Neural cells), and
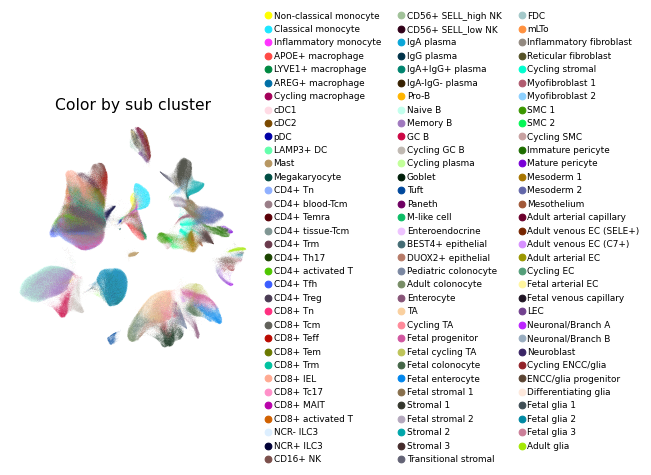
101 cell subtypes. scIBD provides a multi-functional and user-friendly interface that provides interactive visualization for biologists to
analyse the transcriptome features, gene regulatory networks and enrichment of given gene set in each cell subset.
Q2: What are the feature functions of scIBD?
We have integrated 12 datasets from multiple studies which investigate the pathologies of IBD, and present a comprehensive single cell transcriptomic atlas for further studying IBD.
With scIBD, users are convenient to explore signature genes of each cell subtype, and compare gene expression of given genes (such as therapy targets, cytokines, IBD-GWAS related genes, or others) between health and disease across major clusters or cell subtypes.
With scIBD, users are also convenient to explore the underlying gene regulatory networks (GRNs) of each cell subtype, and compare the activities of given regulons between health and disease.
IBD is caused by a complex interaction between genetic and environment factors (such as gut microbes).
Currently, treatments for IBD including 5-ASA, antibiotics, steroids, immunosuppressants, and biologic therapies (including anti–tumor necrosis factor [TNF] antibodies, anti–α4β7 integrin antibodies, and anti–IL12/23 antibodies).
For convenience,scIBD also collected clinical trials, therapy targets, and GWAS-implicated risk genes to give a quick glance of advances in the treatment of IBD.
With scIBD, user could capture both the enriched cell subsets and gene expression profiles of the risk genes for UC and CD or any given gene set.
Q3: How did you perform the cell type annotations?
Preprocessing and integration of scRNA-seq datasets were performed with Scanpy.
Raw count matrix of gene expression of all samples in all datasets were merged.
We used a double-MAD (median absolute deviation) method to detected the outliers of number of expressed genes in all cells with lower threshold of 1.5 and upper threshold of 10.
As a result, cells with fewer than 399 genes or more than 6,849 genes, or > 25% mitochondrial UMI counts were filtered out. Samples with less than 100 cells were dropped.
Then, we used a two rounds clustering strategy to integrate, cluster and annotate major clusters and minor clusters.
In the first-round clustering, immunoglobulin genes, T cell receptor (TCR) genes, and ribosome-protein-coding genes (gene symbol with string pattern “^RP[0-9]+-|[LS]”), cell cycling genes (e.g. TOP2A, MKI67), and mitochondrial genes were removed from the combined gene expression matrix.
For each cell, the UMI counts of genes were divided by the total UMI count of the cell and then scaled by 1e4, and then log-transformed.
Top 2,000 highly variable genes were identified across cells and samples (with highly_variable_genes function with scanpy (v1.8.2, n_top_genes=2000 and batch_key = “sampleName”).
These 2,000 highly variable genes were used for downstream analysis. The expression values of each gene were scaled to unit variance, and PCA were performed.
Batch correction of datasets from multiple studies which covered three developmental stages and multiple disease conditions, was performed with bbknn (v1.5.1, bath_key="sampleName", neighbors_within_batch=3, metric="euclidean", n_pcs =30).
Dimensionality reduction (t-SNE and UMAP) and leiden clustering (resolution=0.1) was performed and major clusters were annotated based on canonical marker genes and differentially expressed genes (DEGs).
In the second-round, integration and clustering of given major cluster were similar to first-round. We checked the gene expression of canonical marker genes, and sub clusters expressed marker genes from other major clusters were considered as doublets and dropped.
Then, each major cluster was integrated and clustered again, and minor clusters were annotated based on marker genes identified from DEGs and published studies.
Contact Details
Scientific Problems
We welcome any suggestions regarding how to improve our database, please feel free to contact us with feedback.
Please contact Hu Nie: niehu2021@163.com
Technical Problems
If you have any questions about the usage of scIBD and the interpretation of results, or encounter problems when using scIBD.
Please contact Hu Nie: niehu2021@163.com
Address
Gaoke Innovation Center, Guangqiao Road, Guangming District, Shenzhen